





















Healthcare predictive analytics only pays off when a risk score changes what a care team does this week, and most of the published research is about the score rather than the change. A readmission model can rank patients sensibly and still leave outcomes exactly where they were if nobody acts on the ranking.
That gap between prediction and prevention is where projects succeed or stall, so it's where this guide spends its time.
What these models actually predict
Most of them estimate the chance of one specific event for one specific patient, and the best-studied event is readmission. A Purdue-led team built a model that predicts whether any patient will return within 30 days of discharge, using hospital administrative records and a plain logistic regression. They suggested the risk estimates could inform discharge decisions and help care coordination.
That's the prevention-first use in its simplest form: spend extra attention on the people most likely to come back.
Sepsis alerts, deterioration warnings and no-show prediction follow the same pattern. A model produces a probability, someone sets a threshold, and a person or workflow responds when a patient crosses it.
How healthcare predictive analytics models perform
Accuracy is moderate at best, and it depends heavily on where the model is tested. The table sets three published results side by side.
| Source | Setting | Reported result | What it tells you |
|---|---|---|---|
| Purdue readmission model | 30-day readmission, administrative data, checked across hospitals and time periods | C-statistics between about 0.68 and 0.76 | Moderate ranking ability that held up reasonably outside the data it was built on |
| BMJ review of EMR readmission models | 41 studies from 2015 to 2019 | Mean C-statistic 0.74 for machine learning, 0.71 for regression | A modest gain from machine learning, not statistically significant |
| JAMA Internal Medicine editorial on the Epic Sepsis Model | 38,455 hospitalizations at the University of Michigan | AUC of 0.63 | A widely deployed commercial model that fell well short of the vendor's reported range |
The reviewers behind the BMJ paper describe the improvement from using electronic medical record data as modest. If someone pitches you a model with near-perfect accuracy on clinical outcomes, ask which patients, which hospital and which year it was tested on.
Why a model that worked elsewhere can fail in your hospital
The Epic Sepsis Model is the clearest cautionary case. Epic and University of Colorado Health jointly reported an AUC between 0.76 and 0.83, yet the University of Michigan's outside check landed at 0.63.
The consequences were practical. Despite generating alerts on 18% of all patients, the model did not detect sepsis in 67% of the patients who had it, according to the editorial's summary of the Michigan findings. That's alert fatigue and missed cases at once.
One hospital is one hospital, and the excerpt of the editorial that we could read doesn't list the study's limitations. Still, the lesson holds for anyone buying a prebuilt model: run it silently against your own patients before it triggers a single page to a nurse.
The Purdue result points the other way, since its model transferred across hospitals and time with relative success. Transfer is possible. It just can't be assumed.
Data quality decides what the model can learn
The BMJ reviewers found that electronic medical record data aren't standardised, and none of the studies they reviewed had properly validated that data. Standard ways of handling missing values were also absent.
Social context is thin too. Socioeconomic and functional status were rarely used as predictors, and only seven studies included any functional measure. A readmission model that can't see whether a patient has someone at home will keep missing the patients who need a phone call most.
Before any modelling, the unglamorous work is mapping where each field lives, how often it's blank and who enters it. A model trained on records full of guesses will reproduce the guesses.
It also pays to ask what the model was never given. If the outcome you care about depends on transport, housing or family support and none of that sits in the record, no choice of algorithm will recover it.
Why clinicians distrust a black box
Photo by Tara Winstead on Pexels
Accuracy isn't the only thing that decides whether a flag gets used. The BMJ authors list the interpretability of machine learning "black box" models, rare handling of class imbalance and limited parsimony as barriers to clinical buy-in.
In plain terms, a nurse who can't see why a patient was flagged has little reason to change a plan. Simpler models that show their reasoning may win adoption even when a more complex one scores slightly higher, and that's a trade you should decide on deliberately rather than inherit from a vendor demo.
Where the prevention happens: workflow, not the score
A score on a dashboard nobody opens prevents nothing. The value arrives when the prediction lands inside a screen a clinician or coordinator already uses, tied to a specific next step such as a follow-up call, a medication review or a transport arrangement.
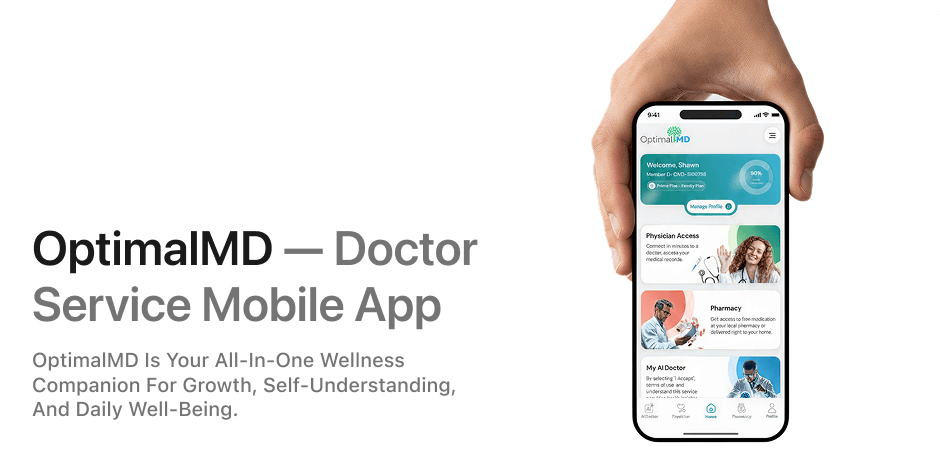
That's a product design problem as much as a data science one. When we built OptimalMD's digital product, we designed and delivered the website, the members portal and the mobile app end to end, as covered in our OptimalMD case study. Anything predictive has to live in surfaces like those to be used at all.
Automation helps once the response is defined. Reminders, task routing and outreach sequences can fire from a risk flag without anyone re-keying it, and our write-up of healthcare AI automation ideas covers the workflows that tend to come first. If you need the interface or the integration built, that falls under our apps and SaaS development work.
A sequence for starting without wasting a year
The BMJ authors noted that only about 5% of the studies they reviewed reported on implementation or clinical usefulness, and only 15 of the 41 calibrated their models. Those are the two weak spots to plan around.
- Pick one outcome with a clear action attached, such as 30-day readmission for a single service line.
- Audit the fields the model would use for completeness and consistency before choosing a method.
- Test any model, built or bought, quietly on your own historical and live patients and record how many alerts it would have fired.
- Calibrate it so a predicted 20% risk means roughly one in five.
- Decide who receives the flag, what they do and how you'll measure whether outcomes moved.
The analytics foundation matters as much as the model, and our piece on healthcare data analytics covers how to get reporting in shape first. Teams planning custom AI work can see how we approach it on the AI and automation service page.
Frequently asked questions
What data do healthcare predictive models use?
It varies by model. The Purdue readmission model used administrative records covering demographics, diagnoses, procedures and discharge disposition, while the models in the BMJ review drew on electronic medical record data.
Are machine learning models better than regression?
Only slightly in the evidence we read. The BMJ review reported a mean C-statistic of 0.74 for machine learning and 0.71 for regression, and the difference was not statistically significant.
Do these models account for social factors?
Rarely. The BMJ reviewers found socioeconomic and functional status were seldom included, and caregiver availability was captured in few studies.
Is there proof that risk scores reduce readmissions?
The sources we read don't show it. Only about 5% of the studies in the BMJ review reported on implementation or clinical utility, so the impact of acting on a score remains largely unmeasured.
Cover photo by olia danilevich on Pexels