











Understanding Retail Branding Conversion Rate
If two stores post identical weekly sales numbers but one of them requires double the visitors to achieve that, conversion rate is where they diverge. Retail branding conversion rate measures what percentage of visitors, whether online or in-store, actually become buyers.
It gives you a direct line connecting your marketing investment to the ability to transform attention into real sales. The clarity it provides shows exactly where your branding and shop floor experience are delivering, and where they fall short.
You calculate this easily: divide all transactions by unique visitors, then multiply by 100.
By tracking this figure not just overall but hourly, by segment, or by channel as time passes, you quickly identify leaks in your operation or spot branding improvements well before these shifts register in sales numbers. That reveals what works and what doesn't.
Much sooner than sales tallies ever could.
Retail Store Conversion Rate Optimization: The Levers That Matter
Crowded stores sometimes underperform badly. Quiet ones sometimes lead their markets. Why? That typically comes down to five operational levers that drive conversion: traffic quality, visual merchandising choices, staff engagement and timing, in-store audio atmosphere, and checkout friction. Every one of those determines if someone walks out empty-handed or with a bag.
Reliable measurement is vital here. Without accurate footfall data, including trustworthy headcounts at every entrance. You can't distinguish whether a sales dip signals lower traffic or a weaker close rate per visitor.
Chains that add modern AI video counting systems gain real insight into visitor flows and can match staff schedules more precisely to the times when people actually need help.
One apparel retailer moved from point-of-sale reporting only to true footfall analytics; as a result, they recorded a 14% increase in conversion rate over six months.
Staffing strategy usually delivers wins fastest. Adjust your rosters to align with hours when conversions peak for maximum effect. Don't just fill out the busy slots, concentrate on when shoppers convert best even if traffic isn't at its highest point. Layout has weight too.
Heatmaps expose zones packed with browsers but light on buyers, highlighting the exact places where simply relocating hero items or refreshing displays could yield big gains.
Visual Merchandising Conversion Rate: Turning Browsers Into Buyers
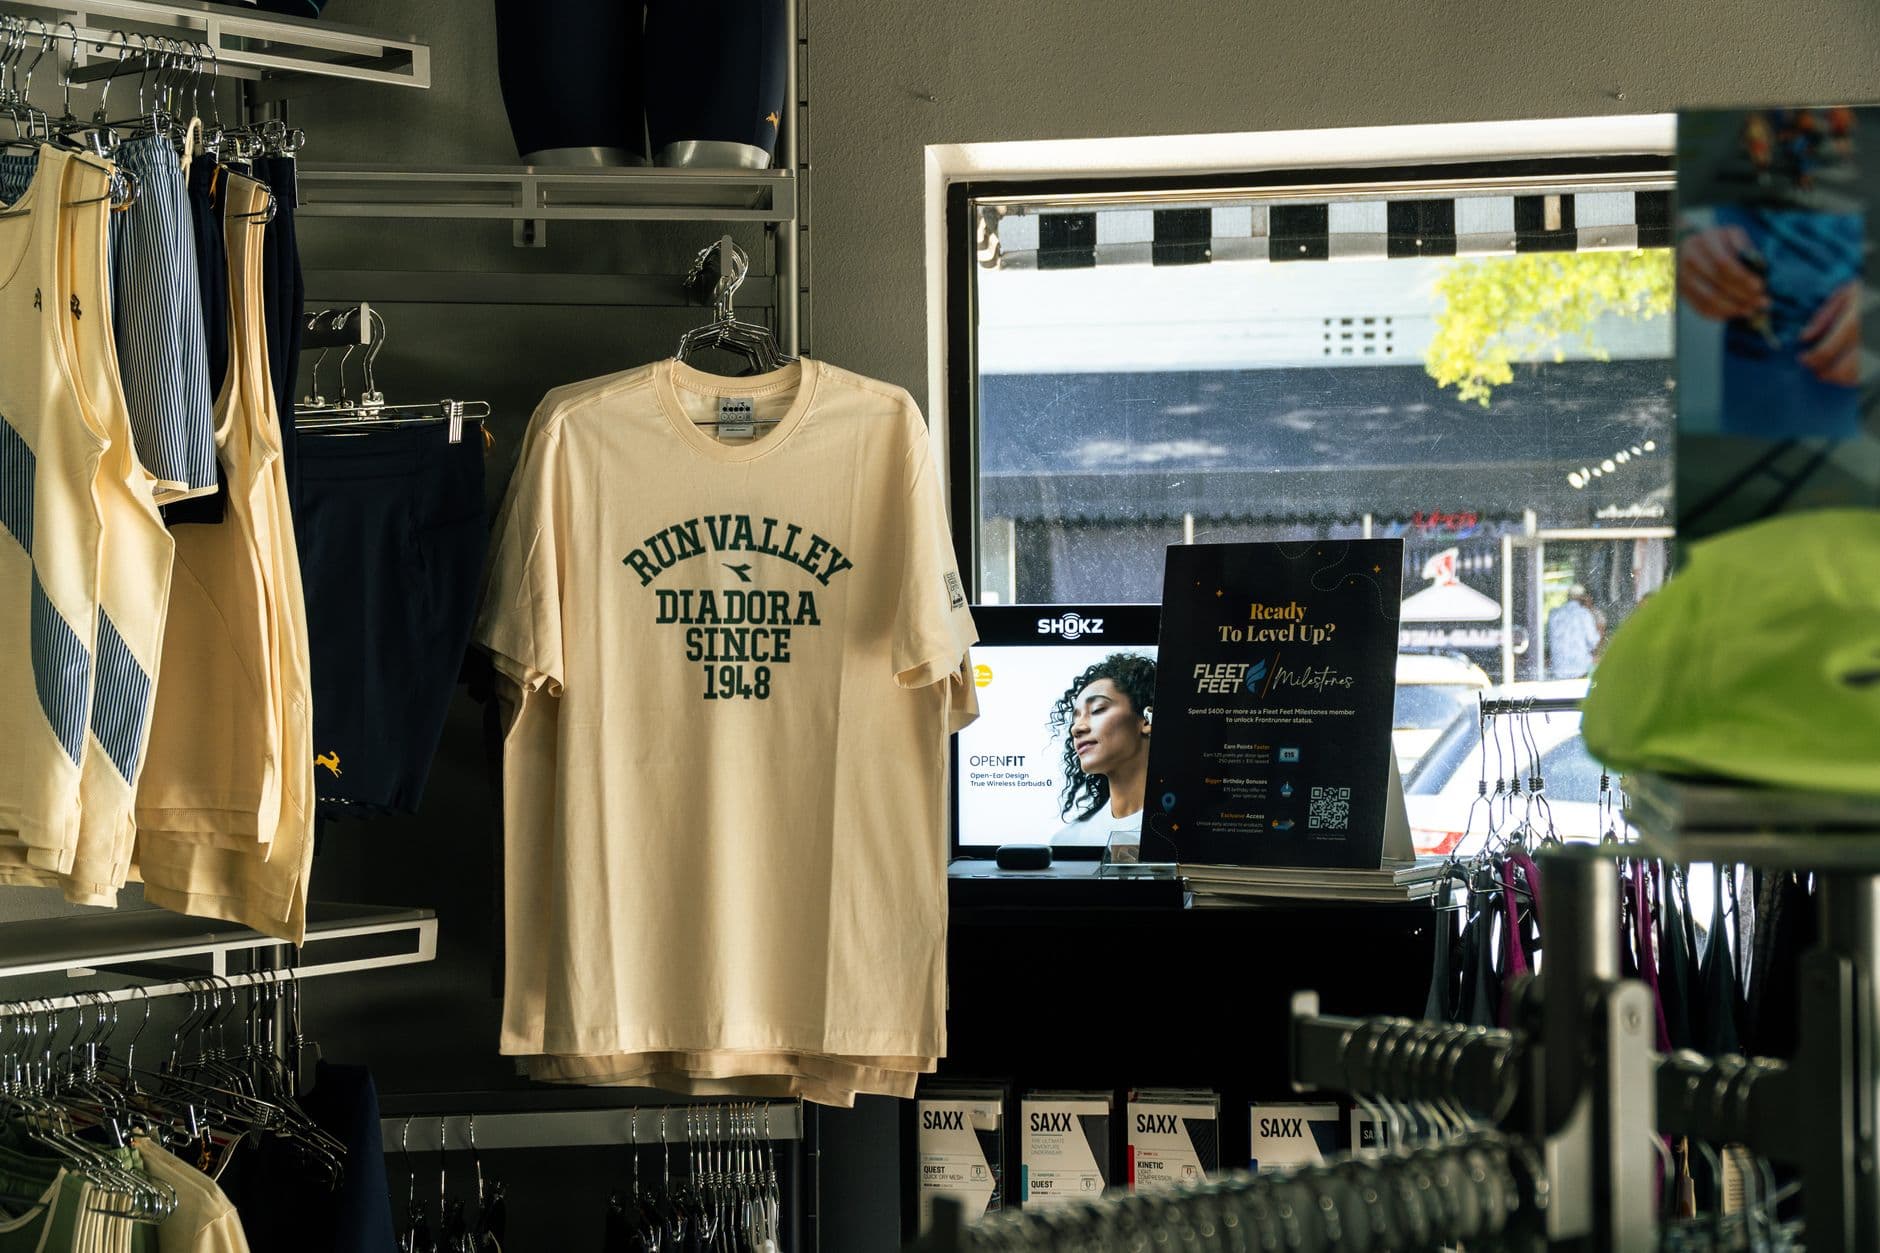
A large crowd walking in won't matter if displays never move them closer to purchase. Visual merchandising conversion rate measures how window displays, careful product placements, clear signage, strategic lighting, even music and fragrance, lead browsers to become buyers.
The best teams watch for more than raw sales lifts; they check dwell time at displays and track which zones see plenty of passersby but few purchases occur there. When shoppers pause but walk away without buying, unclear prices or missing signs often stand in the way.
Brands refreshing their displays every few weeks can see a 10–20% rise in conversion. Proper execution across locations boosts not only store footfall but total transactions too.
Key metrics: Track store-wide conversion for overall progress; monitor sell-through rates on featured displays; measure dwell time for display engagement issues; run zone-by-zone analysis to uncover placement stars.
The Sales Impact of Retail Brand Identity
A retail brand identity is never mere decoration; it actively shapes sales results. The combined effect of visual identity, logos, color schemes, store layout, and storytelling through every possible channel plus stated values together build buyer trust long before any purchase takes place.
This built-in trust lowers acquisition costs because branded search grows organically over time while simultaneously allowing you to keep prices higher without relying so heavily on discounts and promotions. Booths supermarkets did an end-to-end identity revamp across stores, and after renovations they achieved 16.5% growth in sales. Carefully targeted campaigns lifted order volumes during the most important seasonal windows.
Strong brand identity also improves repeat purchases because every touchpoint sets clear expectations, in web shops and physical ones alike. In fashion and beauty especially where emotional ties drive loyalty, sharp brand presence boosts average order size and protects margins from endless discount wars.
E-Commerce Retail Branding Conversion: Digital Identity Meets Frictionless UX
The same critical drivers apply online as well as offline; in e-commerce retail branding conversion work margins are even thinner so tiny optimizations make an outsized impact on results. Most online shops convert about 3% of visitors into buyers, with higher rates only achieved when website basics are absolutely flawless.
One study tracked direct-to-consumer brands who overhauled their Shopify sites; after just three months focused on clarifying product hierarchies and trimming subscription process barriers, their checkout conversions rose from 2.1% up to 4.6%.[9] Mobile speed remains non-negotiable now because slow load times cause customers to leave before reviews or stories sway them.[3]
Tactics that win: Use sharp product photography on clean backdrops; put calls-to-action high up front; declare shipping costs early; offer single-page guest checkouts; show customer content next to products as proof; fuel tailored recommendations along every part of the journey.
Tactics that convert: Carousels with review snippets build trust fast while personalized offers based on browsing patterns prompt more carts without always slashing prices everywhere.[2],[3]
Benchmarking Retail Conversion Rate Across Sectors
No universal benchmark fits all categories, conversion rates range widely by sector:
Grocery & supermarket: 35–50%
Fashion & apparel: 20–35%
Electronics & tech: 10–20%
Luxury & jewellery: below 15%
E-commerce averages sit at about 1.5%–4%. Top food and beverage brands can reach over 6%. Most brick-and-mortar fashion retailers run between 20–40%. Buyer intent plus ticket size still rule these numbers.[1],[15]
Tying It Together: Making Branding Drive Sales Conversion
No lever works without disciplined measurement or follow-through, impeccable design is meaningless if it never makes it onto your floor or website as conceived.
Edit one variable at a time so you know which change drove numbers up or down, this applies whether switching signage in-store or fine-tuning mobile UX bugs online.
Alone, no metric pinpoints why branding fails to sell, but watching conversion trends alongside dwell times, repeat visitor percentages, basket sizes and feedback reveals exactly where your shop creates fans versus where attention simply fizzles away without action at all.