



















Most CRM automation projects get judged on a feeling, because nobody wrote down how many hours follow-up work took before the workflows went live. A CRM automation ROI calculator is only as good as the baseline you feed it, so the first job is measuring today's manual work, not choosing the formula.
The formula itself is short. Everything that makes it useful or useless sits in what you count on each side of it.
The ROI formula and what belongs on each side
ROI is total gain minus total investment, divided by total investment, times 100. LeadSquared's CRM ROI guide gives the plain version: spend $1,000, generate $1,500, and your net gain is $500, which is a 50% return.
For automation specifically, split the gain into two parts. One is the value of hours your team no longer spends on manual work. The other is revenue you wouldn't have had without it, such as leads that used to go cold because nobody replied in time.
Put the investment on the other side: software, setup, training, and the hours someone spends running the system afterwards.
Costs that get left out
The subscription is the visible cost, and it's rarely the largest. Implementation covers data migration, custom workflows and integrations. Training takes staff time away from selling. Maintenance never stops, because workflows break when your offers, forms or team change.
The least visible cost is lost productivity during rollout, while people adapt to a new system. LeadSquared lists it explicitly, and it's the reason ROI can be negative in the first months, usually from low adoption or a poor fit with how the team actually works.
Count it anyway. A calculator that ignores the rollout dip will look better on paper than your first quarter does in practice.
Turning saved hours into dollars
Multiply hours saved per person per week by their loaded hourly cost, then by the number of people doing that work. That's the whole calculation, and it's the part of the return you can trust most.
Nucleus Research looked at 11 CRM case-study calculations from 2023 and found that individual productivity gains and process efficiency made up 51 percent of total ROI. Increased revenue contributed the least. Time savings are where a first calculation should start.
Measure before you switch anything on. Log the weekly hours spent on data entry, reminders, follow-up emails and status updates for two or three weeks, then repeat the count after launch. Without that first count, "we save about ten hours a week" is a guess dressed as a result.
Baselines worth capturing on day one
Time isn't the only thing to record. Lead response time, close rate, sales cycle length and cost per lead are all numbers a workflow can move, and all of them are cheap to read from your CRM today. Customer-side numbers, like churn and retention, belong on the list if you automate renewals or onboarding.
Revenue lift: the number to be conservative with
Revenue is the most tempting input and the hardest to defend. Closed deals have many causes, and a CRM workflow is rarely the only one, so crediting it with every extra sale inflates the result.
Two habits keep it honest. Compare equal-length periods under similar market conditions, and when you can, compare a group using the automation against one that isn't. Then claim only a share of the difference. A conservative partial attribution survives a finance team's questions; a full one doesn't.
Where attribution is unclear, LeadSquared suggests proxy metrics such as conversion rate and retention instead of forcing a dollar figure. Use those as supporting evidence rather than as dollars in the formula.
A worked example with real numbers
Salesmate, itself a CRM vendor, publishes a worked example that shows the structure clearly. Treat the figures as illustration, not as a benchmark you should expect.
| Line | Amount | What it buys |
|---|---|---|
| Software over two years | $25,000 | The licences |
| Training and maintenance over two years | $20,000 | Adoption and upkeep |
| Total investment | $45,000 | The cost side of the formula |
| Extra revenue generated | $120,000 | The gain side of the formula |
| Net profit and ROI | $75,000 and 166.7% | $75,000 divided by $45,000 |
Notice what the example leaves out. It books all $120,000 as the CRM's doing, and it doesn't discount costs or gains across the two years. Both choices flatter the answer, which is why your own version should use partial attribution and an honest time frame.
Building a CRM automation ROI calculator in a spreadsheet

Photo by Shuaizhi Tian on Pexels
You don't need a dedicated tool. A single sheet with four blocks does the job, and you can rebuild it for each workflow you automate.
- Baseline block: weekly manual hours, lead response time, close rate and cost per lead, measured before launch.
- Cost block: subscription, setup, training, ongoing admin hours at a real hourly rate, and an estimate of rollout productivity loss.
- Gain block: hours saved converted to dollars, plus a discounted share of any revenue lift you can tie to the workflow.
- Result block: net ROI as a percentage, and payback in months, which is total investment divided by monthly net gain.
Keep one row per workflow rather than one total for the whole system. Lead-capture follow-up and invoice reminders pay back at different speeds, and a single blended figure hides the one that isn't working.
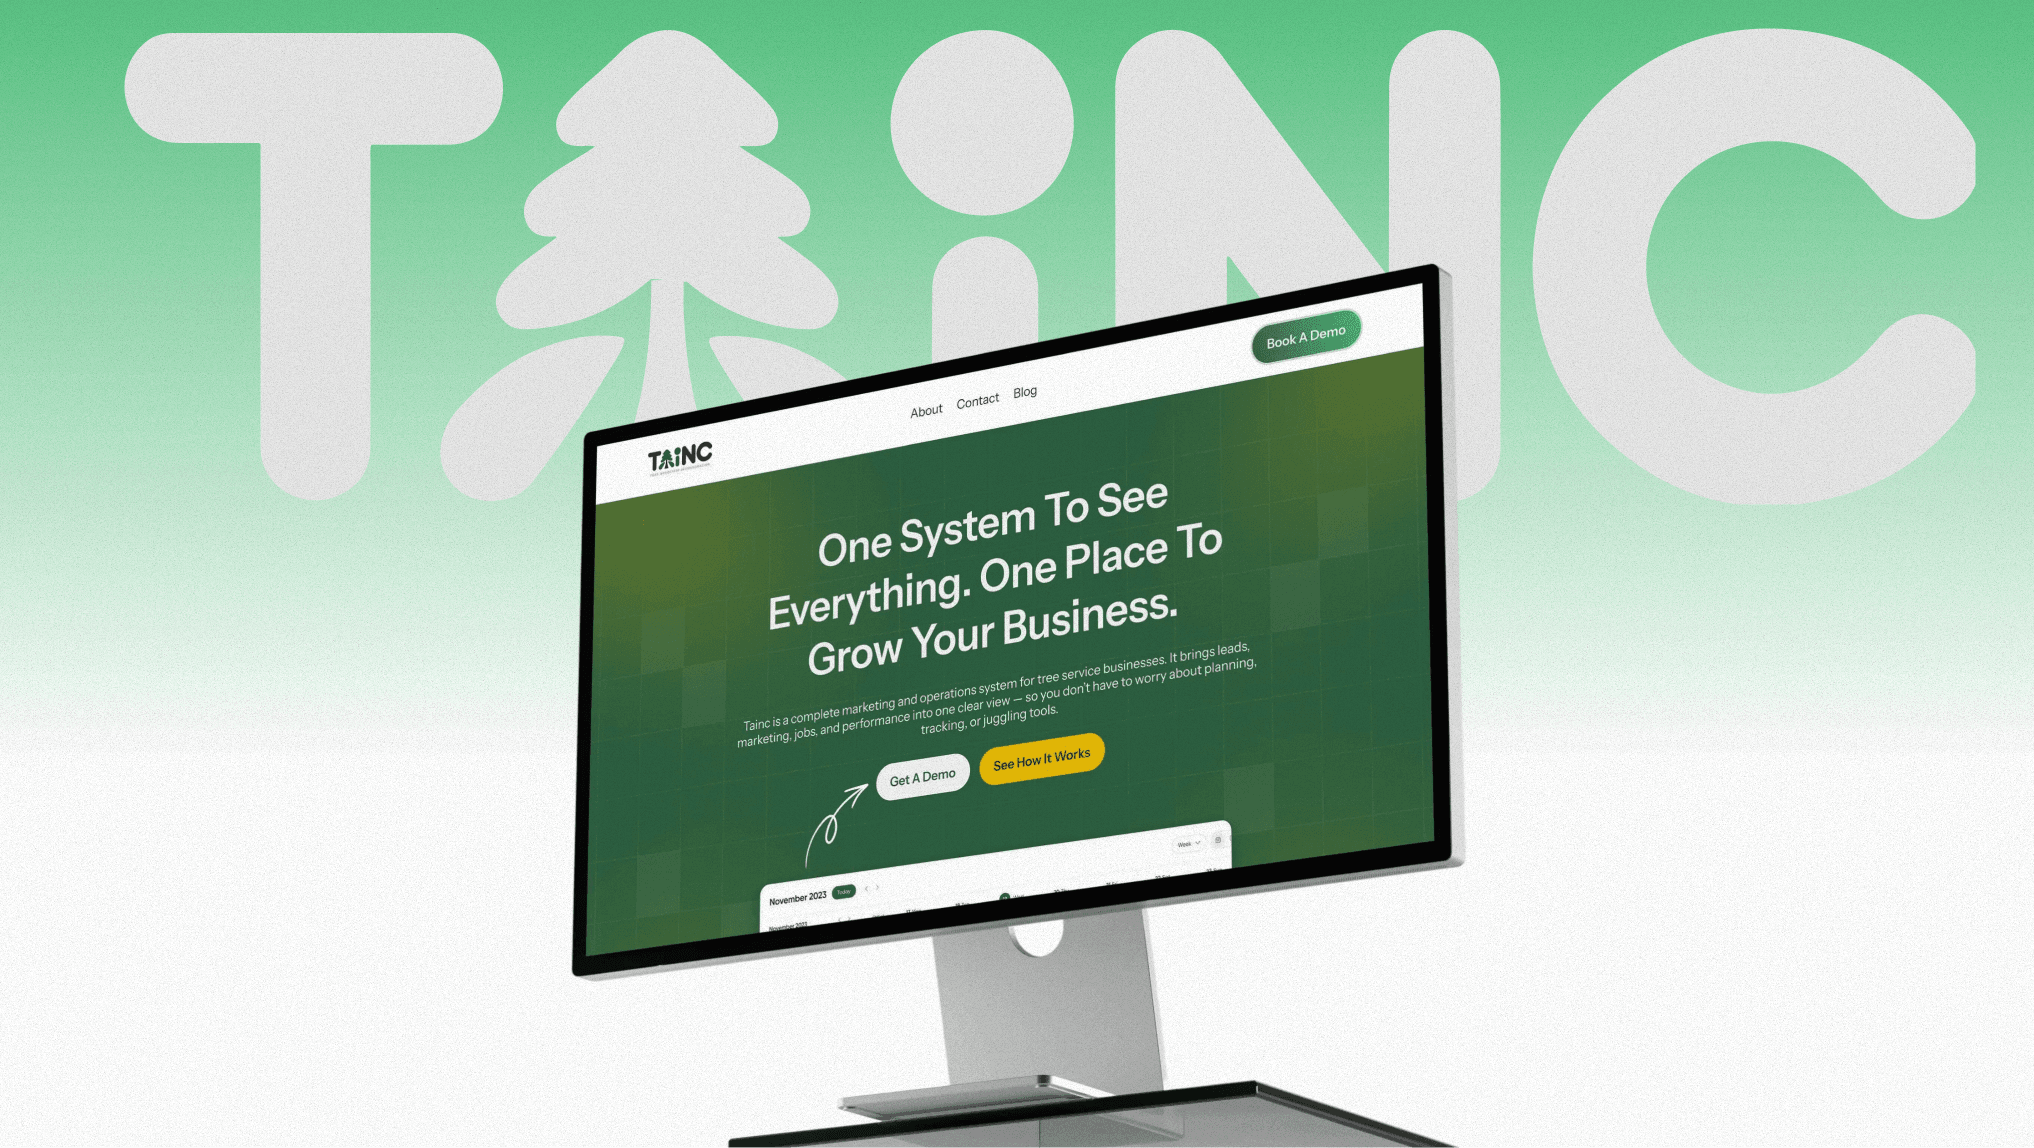
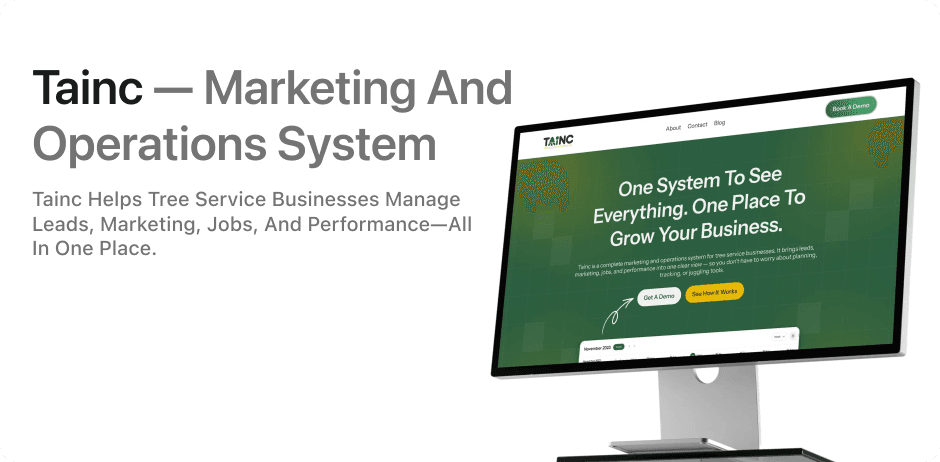
When we built the platform for TAINC, a growth platform for tree service businesses, the problems it targeted included untracked marketing spend and ROI, and leads lost to slow manual response. Those two are exactly the baseline rows above, and a business that can't see them can't calculate a return on fixing them.
If your CRM is GoHighLevel, the setup decisions behind these workflows are covered in our guide to GoHighLevel CRM setup for small business, and our AI and automation service is where we build the workflows themselves.
How long before the numbers turn positive
Expect time savings first and revenue second. LeadSquared says many businesses see measurable benefits within 6 to 12 months, with efficiency gains usually arriving before revenue gains. Salesmate puts the typical return at 12 to 18 months, depending on adoption and how fully the system is used.
Both ranges come from vendors, so read them as the shape of the curve rather than a promise. The pattern that matters is the order: hours first, dollars later.
Review the sheet quarterly. Rerun the baseline block each time, because an automation that saved ten hours in March can lose most of that by September if the team routes around it.
What the benchmarks say, and how far to trust them
Published returns vary widely, and many are averages of vendor-supplied case studies. Nucleus Research's January 2024 note put the average at $3.10 returned per dollar spent and said CRM returns had fallen 37 percent over the previous 10 years.
That's a sobering number next to the 280% figures vendors like to quote. Use benchmarks as a sanity check on your own sheet. If your calculator returns ten times the Nucleus average, recheck your attribution before you present it.
If you're comparing platforms before committing, our breakdown of GoHighLevel vs HubSpot shows how pricing models change the cost side of this formula.
Frequently asked questions
What is a good ROI for CRM automation?
There's no reliable universal figure. Nucleus Research's 2024 analysis of 11 case studies averaged $3.10 per dollar spent, while vendor benchmarks run much higher. Judge your own result against your cost of capital and a payback period you can defend.
Should I include soft benefits like customer satisfaction?
Track them, but keep them out of the dollar formula unless you can tie them to a measurable outcome such as retention. LeadSquared notes that intangible benefits are hard to value in dollars.
How long should I measure before judging the results?
Give it at least two quarters. Time savings tend to show up first, and revenue effects take longer to separate from everything else happening in the business.
Why can CRM ROI be negative at first?
Rollout costs land before benefits do. Low adoption or a poor fit with existing processes can keep the return negative early on, which is why training and process mapping belong in the cost block.
Cover photo by Polina Tankilevitch on Pexels
Sources
- CRM benefit areas with the greatest ROI impact — Nucleus Research
- How to calculate the ROI of your CRM investment — LeadSquared