Skip to content
+
+
+
+

Indianapolis, Indiana

Your competitionA growing marketThe cost of answering the phoneNew businesses

AI automation marketing agency for Indianapolis local businesses

Westfield grew 35.6% between 2020 and 2024, and Brownsburg and Avon each added about 15%. Across greater Indianapolis, 68.5% of homes are single-family detached houses, and two in three households own the place they live in. Octopi Digital helps owners in Marion, Hamilton, Hendricks and the surrounding counties with websites, local SEO, branding and AI that answers calls, books jobs and follows up, so the growing suburbs reach you first.

Scroll
people in the Indianapolis area
2,174,833
population change since 2020
+4.1%
businesses with employees
51,076
homeowner households
580,219

Sources: U.S. Census Bureau population estimates 2024, County Business Patterns 2023, American Community Survey 2024.

Why Indianapolis businesses grow with Octopi

What the Indianapolis numbers mean for your business

The local facts that matter most here, and what we'd do about each one.

  • Your competition

    2,306

    home-service businesses with employees

    2,306 home-service companies compete for the same searches in Indianapolis.

    The Indianapolis area has 183 roofing contractors, 798 landscaping and tree care companies and 598 plumbing and HVAC firms with employees, plus 175,962 one-person businesses of every kind. Landscaping businesses grew 2.1% in the year to late 2025. When everyone offers the same service, the company that shows up first on Google and in AI answers, with real reviews and a fast website, gets the call.

    How we help: Digital Marketing & SEO

    Source: U.S. Census Bureau, County Business Patterns 2023; Nonemployer Statistics 2022; BLS QCEW Q4 2025

  • A growing market

    4.1%

    population growth since 2020

    The Indianapolis area grew 4.1% since 2020.

    That's 85,164 more people, with the economy up 15.7% after inflation since 2019 and income per person up 35%. A growing market rewards the businesses that are easy to find and quick to respond, and punishes the ones still relying on word of mouth alone.

    How we help: Digital Marketing & SEO

    Source: U.S. Census Bureau, Population Estimates 2024; U.S. Bureau of Economic Analysis

  • The cost of answering the phone

    $37,050

    median receptionist pay, Indianapolis area

    Indianapolis receptionists earn a median $37,050 a year. Calls don't stop at 5 p.m.

    The median receptionist in the Indianapolis area earns $37,050 a year in pay alone, before payroll taxes and benefits, and covers about 40 of the week's 168 hours. An AI receptionist answers every call, day or night, books the appointment and texts you the details, so the calls that come in after hours still turn into jobs.

    How we help: AI Automation

    Source: U.S. Bureau of Labor Statistics, OEWS May 2025

  • New businesses

    39,814

    business applications in 2025

    39,814 new businesses applied to open in the Indianapolis area in 2025.

    That's 69% more than in 2019. Every one of them needs a name, a logo, a website and a way to be found, and every one is a new competitor for the businesses already here. A clear brand and a website built to turn visitors into calls is how you stand out from both.

    How we help: Web Design

    Source: U.S. Census Bureau, Business Formation Statistics

  • Mobile first

    9.8%

    of households are smartphone-only

    9.8% of Indianapolis households go online only by phone.

    For them, there's no desktop version of your website. If your site is slow or awkward on a phone, they tap back and call the next result. We design mobile-first: fast pages, tap-to-call buttons and short quote forms that work with one thumb.

    How we help: Web Design

    Source: U.S. Census Bureau, American Community Survey 2024

Want this working for your business in Indianapolis?

Book a free strategy call and we'll show you where to start.

Local analysis

What this means for a Indianapolis business

Written for Indianapolis-area owners from U.S. Census Bureau data on the people, homes and businesses here. The numbers behind each point are in the sections below.

Updated 

The suburbs are where the growth is

The balance of Indianapolis city grew just 0.4% from 2020 to 2024. Around it, Westfield grew 35.6%, Greenfield 12% and Plainfield 9.1%, and Hamilton County now has about 380,000 residents. A plumber or landscaper whose website only says Indianapolis is invisible to many of those searches. We would build town-by-town service pages for places like Westfield, Brownsburg and Avon, set the Google Business Profile service area to match, and run search ads in the counties where new households are landing, so your local SEO spend goes where customers are moving.
Short on electricians and pest control

Electrical contractors run at 0.79 times the U.S. rate per person, with 419 firms, and pest control is the same at 0.79 times, with just 84. Electrical jobs rose 10.5% in the year to late 2025, a sign that firms are hiring to keep up. When supply is tight, customers wait, and many call two or three companies. For an electrician here, we would set up AI that answers every call, books the visit straight into the schedule and texts a time, so you hold the job instead of losing it to whoever calls back first.

Mostly gas heat

About 56.3% of households heat with gas, 38.9% with electricity and 3.4% with propane, and the median home was built in 1985. That keeps furnace repair and replacement at the center of HVAC demand. Labor is costly too: plumbers here earn a median $76,980 a year, more than the $65,130 for electricians. Every minute spent on the phone instead of on the job costs money. We would build a fast website with clear pages for furnace repair, water heaters and drain work, plus an online booking form, so customers schedule themselves without tying up a technician.

More new shops than before

The opening rate for new establishments climbed from 9.2% in 2019 to 11% in 2023. In the year to late 2025, painting firms rose 6.3% and pest control firms 5.1%. Each new competitor makes the search results more crowded. Reviews decide many of these contests, because a homeowner in Carmel or Fishers will often pick the company with the most recent five-star feedback. We would set up a review request that goes out by text after each job, help you reply to every review, and post job photos to your profile weekly.

What we build

Our services for Indianapolis businesses

Each service, with the local reason it matters most here.

  • A growing market

    AI Automation

    The Indianapolis area grew 4.1% since 2020.

  • Your competition

    Web Design

    2,306 home-service companies compete for the same searches in Indianapolis.

  • 29% of Indianapolis homeowners moved in since 2020.

  • New businesses

    Branding

    39,814 new businesses applied to open in the Indianapolis area in 2025.

  • Mobile first

    UI/UX Design

    9.8% of Indianapolis households go online only by phone.

  • Build vs. hire

    App Development

    A software developer in Indianapolis earns a median $106,870 a year.

  • Build vs. hire

    SaaS Development

    A software developer in Indianapolis earns a median $106,870 a year.

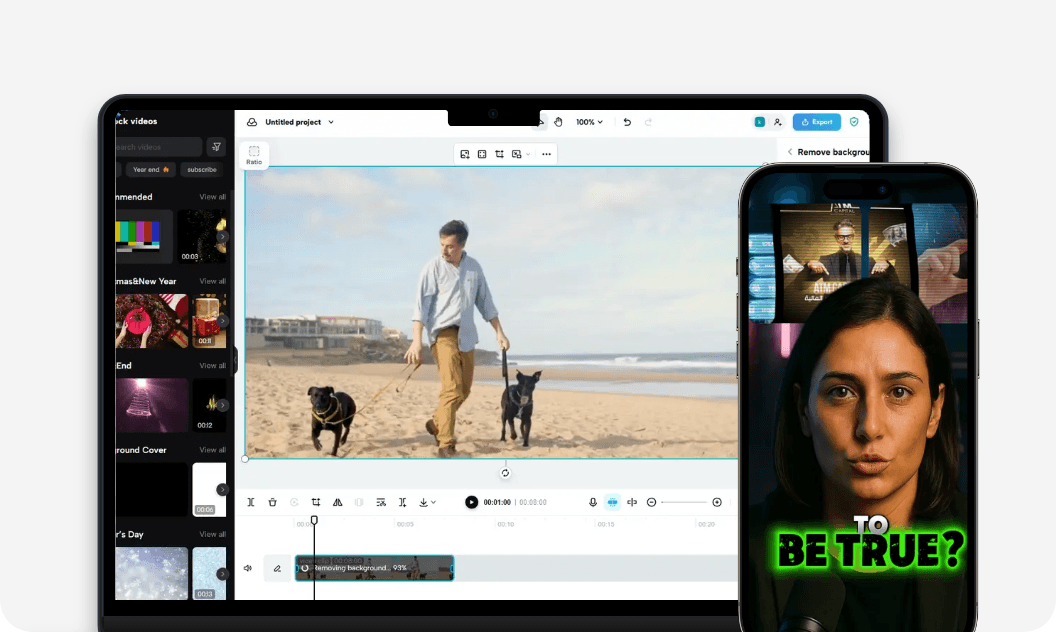
  • Your job-site and office footage, edited into captioned reels, Shorts and ads every month.

Every missed call is a job for someone else

See how an AI front office would handle calls for your business in Indianapolis, on a free call.

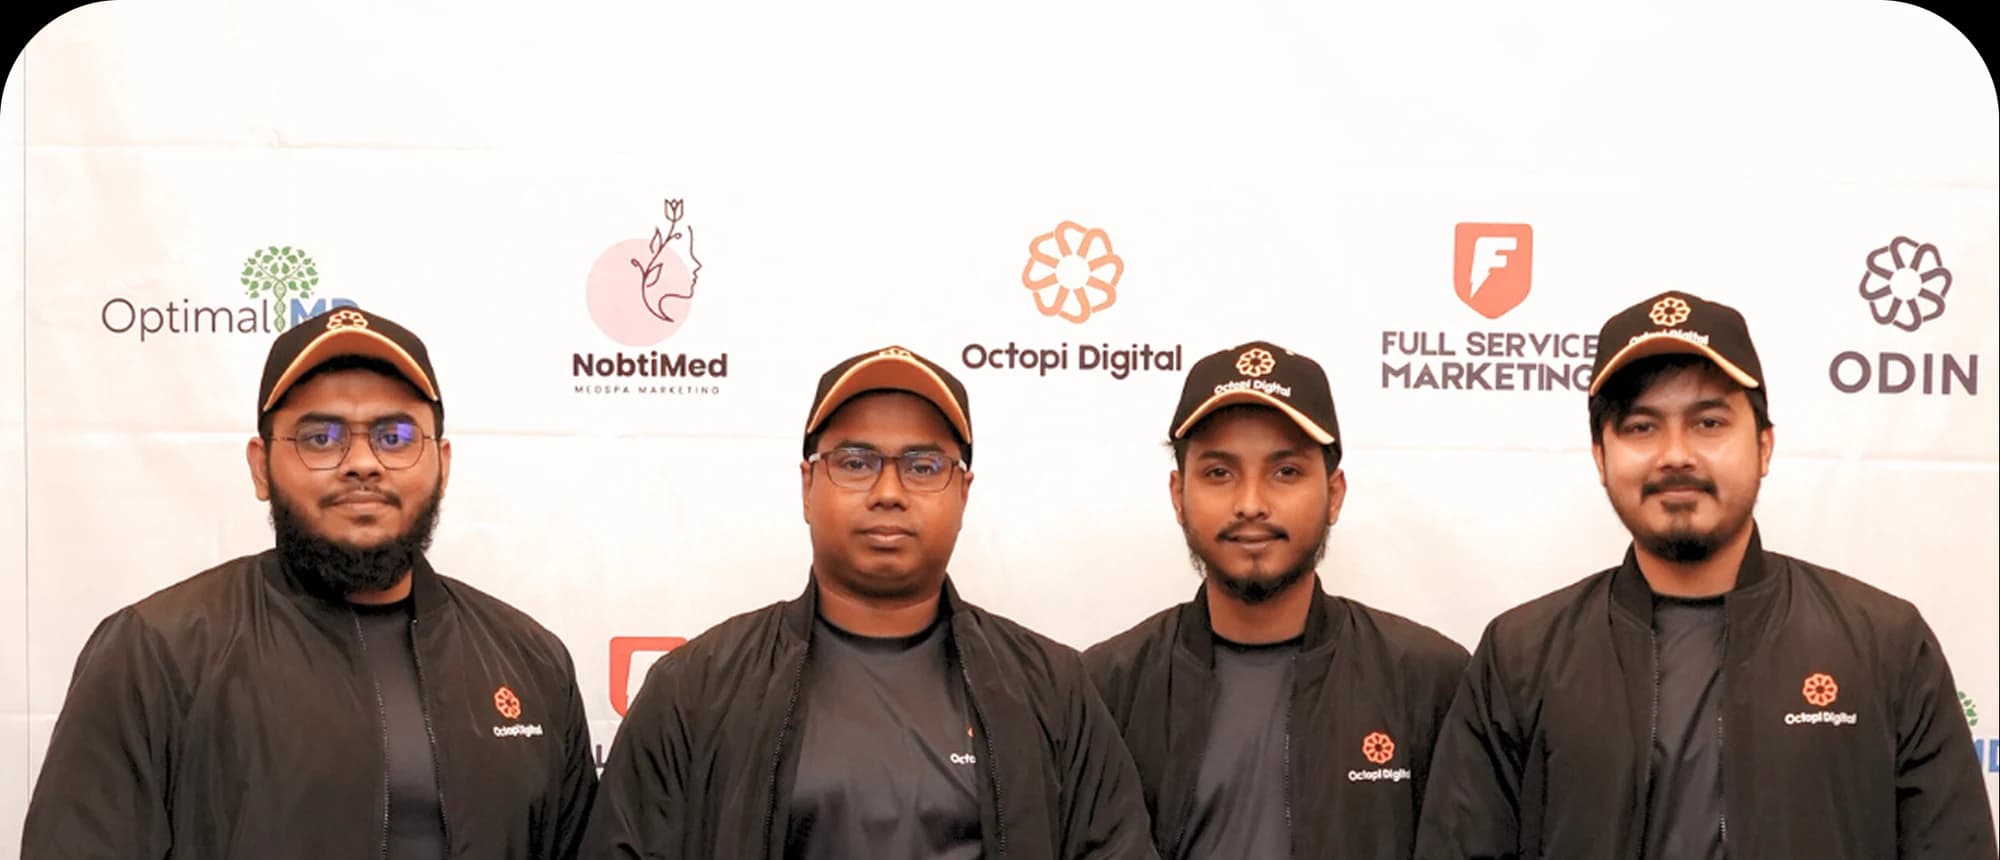
Four Octopi Digital team members at a partner event

The team behind it

Real people set up and run it for business owners in the Indianapolis area.

Your local market

How crowded is your trade in Indianapolis?

Businesses with employees in the Indianapolis area, per 100,000 residents, compared with the U.S. average. Pick your trade to see how crowded it is here, and what that means for you.

Your trade in Indianapolis

Roofing contractors

1.12×

times the U.S. rate per resident · the white tick marks the U.S. average

businesses with employees
183
per 100,000 residents
8.5

Close to the U.S. average. Customers still compare a few options, so the business that replies first and looks best online usually wins.

How we help roofing contractors

Source: U.S. Census Bureau, County Business Patterns 2023 (businesses with paid employees; one-person businesses are counted separately). The Census counts landscaping and tree care together.

Not sure where to start?

A short call with our team, and you leave with a plan and a price.

More local numbers

More about the Indianapolis market

  • New homeowners

    29%

    of homeowners moved in since 2020

    29% of Indianapolis homeowners moved in since 2020.

    New homeowners don't have a roofer, a landscaper or a plumber yet, so they search: they read reviews, compare websites and, more and more, ask ChatGPT or Google's AI who to call. Growth is fastest in Westfield, Brownsburg and Avon. We make sure your business is the one those searches find.

    How we help: Digital Marketing & SEO

    Source: U.S. Census Bureau, American Community Survey 2024; Census population estimates 2024

  • New construction

    9,325

    single-family homes permitted in 2025

    9,325 new single-family homes were permitted around Indianapolis in 2025.

    Every new home needs landscaping, service contracts and, in time, repairs, and every new owner starts with a search. Building is fastest in places like Westfield and Brownsburg. Showing up there first means being first in line.

    How we help: Digital Marketing & SEO

    Source: U.S. Census Bureau, Building Permits Survey

  • Build vs. hire

    $106,870

    median software developer pay, Indianapolis

    A software developer in Indianapolis earns a median $106,870 a year.

    Web developers earn $82,820. That's pay alone, before benefits, recruiting and management time, and one developer is rarely enough. An agency gives you designers, developers and testing for the length of the project, without adding to payroll.

    How we help: App Development

    Source: U.S. Bureau of Labor Statistics, OEWS May 2025

  • Margins

    49%

    of Indiana businesses saw costs rise

    49% of Indiana businesses saw supplier prices rise in just two weeks.

    And 30% say interest rates have cut their profit. When margins shrink, the cheapest growth is the work you already pay to attract but lose to slow replies and missed calls. Automation recovers it without adding a hire.

    How we help: AI Automation

    Source: U.S. Census Bureau, Business Trends and Outlook Survey

  • AI is already here

    21%

    of Indiana businesses use AI

    21% of Indiana businesses already use AI.

    In the Census Bureau's latest business survey (September 21 – October 4, 2026), 21% of Indiana businesses said they used AI in the past two weeks and 25% expect to within six months. The question isn't whether your competitors will use it, it's who replies faster. We set up AI that answers calls, follows up leads and books jobs, done for you.

    How we help: AI Automation

    Source: U.S. Census Bureau, Business Trends and Outlook Survey

Areas we serve

All of the Indianapolis area

88 cities and towns across 11 counties (Boone County, Brown County, Hamilton County, Hancock County, Hendricks County, Johnson County, Madison County, Marion County, Morgan County, Shelby County, Tipton County). We work remotely, so your location within the area doesn't change what we can do.

Largest places in the area

  1. Indianapolis city (balance)891,484
  2. Fishers103,986
  3. Carmel103,606
  4. Noblesville75,239
  5. Greenwood68,175
  6. Westfield62,994
  7. Anderson55,851
  8. Lawrence49,817

Also in the area

  • Plainfield
  • Brownsburg
  • Zionsville
  • Greenfield
  • Franklin
  • Avon
  • Shelbyville

Population, 2024. Source: U.S. Census Bureau, population estimates 2024.

Growing fastest since 2020

  1. Westfield+35.6%
  2. Brownsburg+15.2%
  3. Avon+15.1%
  4. Greenfield+12%
  5. Plainfield+9.1%

Population change 2020–2024. Source: U.S. Census Bureau, population estimates 2024.

See it on your own numbers

Get a free audit: we'll show you where customers slip away today and what we'd fix first.

Industries we know

Work from businesses like yours

Proof from the industries we serve, wherever those clients are based.

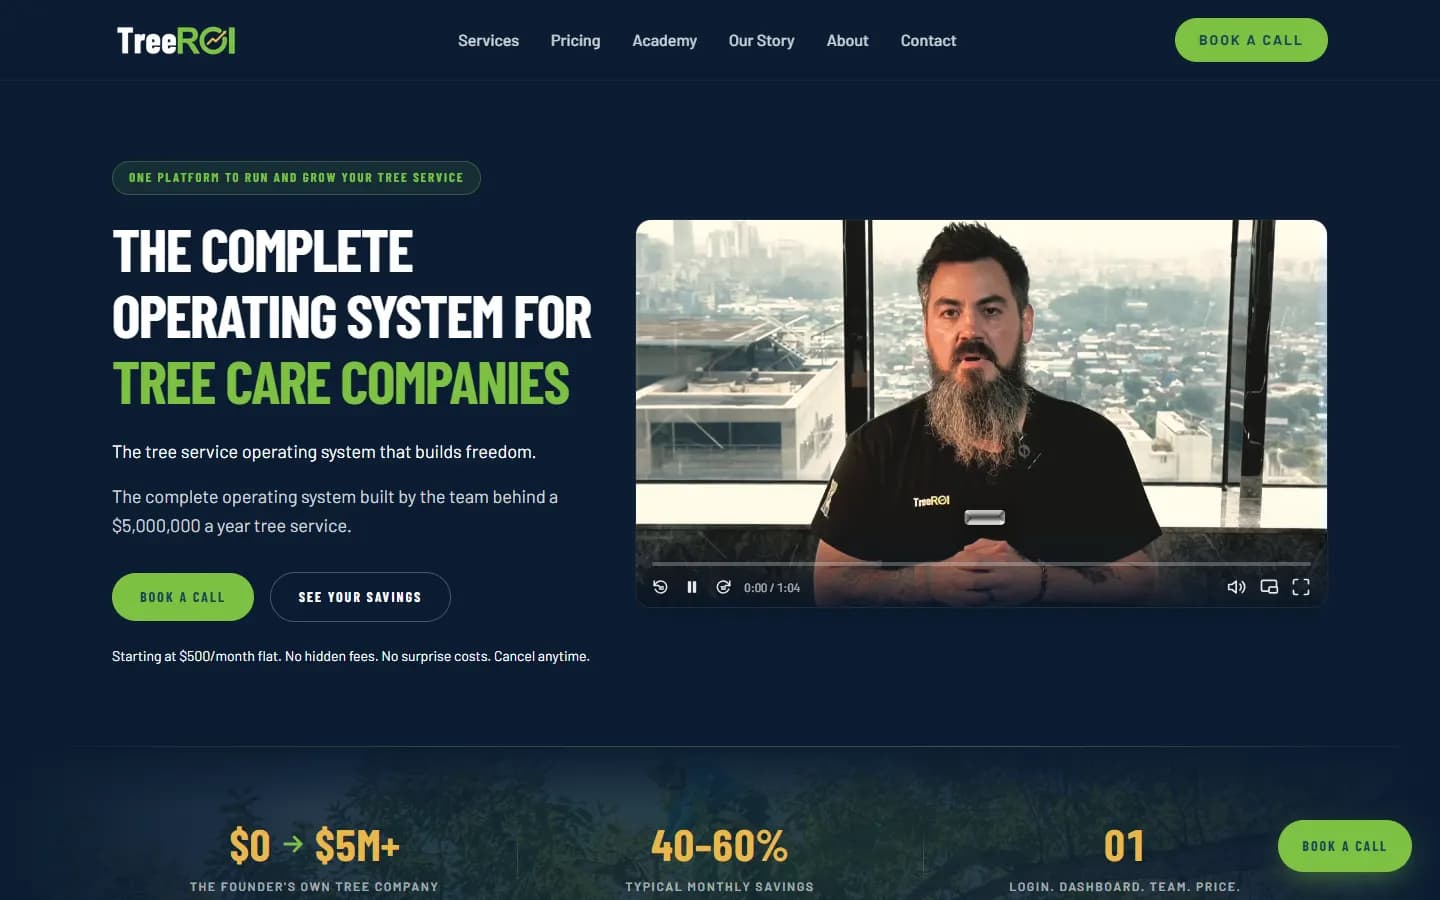
  • AI answering while crews are on a job and storm-surge call handling with emergency triage, set up and run for you. Clients include Monkeyman's Tree Service, TreeROI by OpsROI and APPEX Tree Service.

  • Seasonal upsell campaigns and estimate scheduling, set up and run for you. Clients include GLscapes Inc.

  • Missed-call text-back and AI phone agent for storm-surge call volume, set up and run for you. Clients include 303 Roofer.

  • Estimate requests with photos and measurements and missed-call text-back from the job site, set up and run for you. Clients include Rios Brothers.

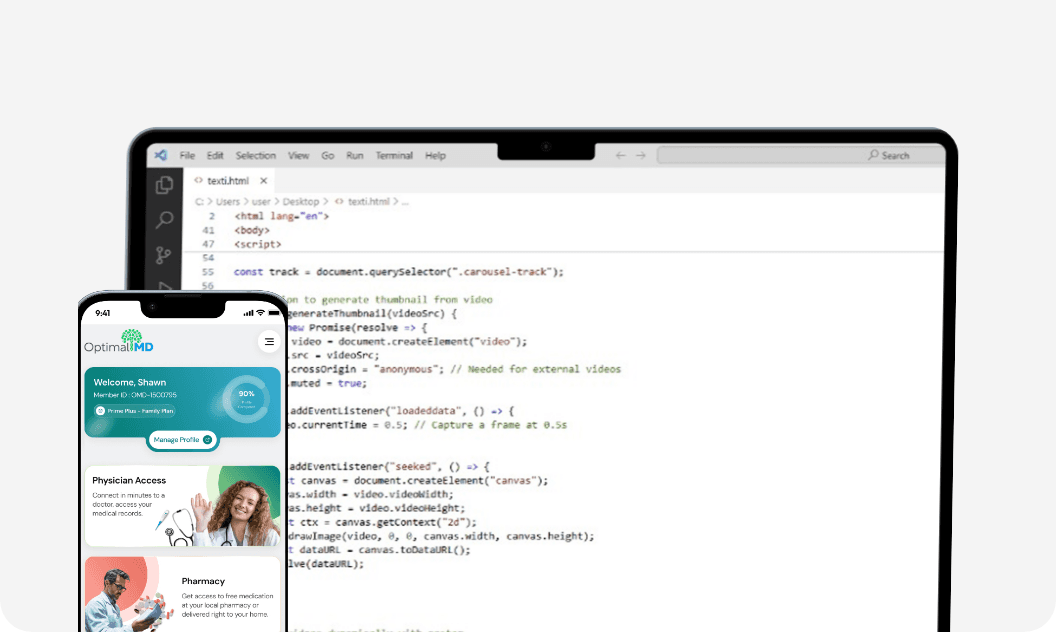
  • Appointment booking and confirmations and reminders, set up and run for you. Clients include OptimalMD.

  • Consultation booking around the clock and missed-call text-back, set up and run for you. Clients include Campbell Dermatology & Aesthetics.

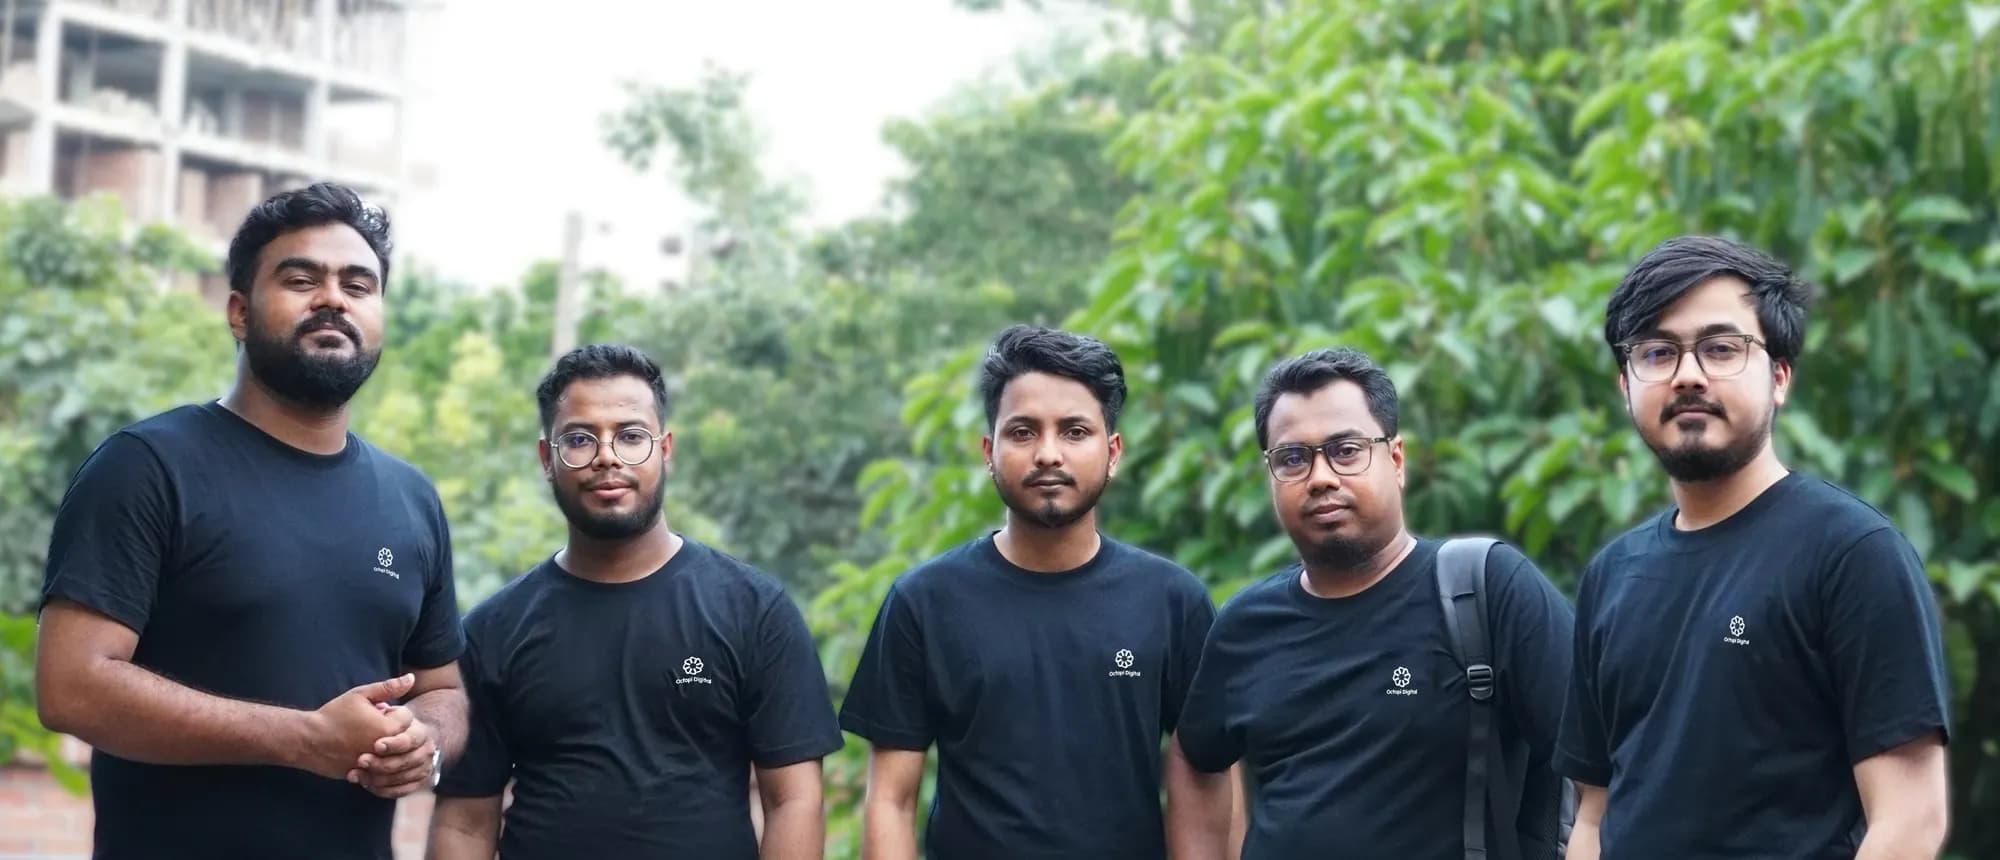
Five Octopi Digital team members on the terrace

How we work

One team for your AI, website and marketing, so it all works together.

Talk to the people who'd build it

Our team sets it up, connects your tools and supports it after launch.

FAQ

Working with Octopi in Indianapolis

Answers for Indianapolis-area business owners.

11 questions answered

Octopi Digital founder

Still have a question?

Talk it through with our team on a free strategy call.

Book a Free Call

Working with us

No. We work with Indianapolis-area businesses remotely from our Albuquerque office, by video call, phone and email, and we schedule calls in Eastern Time. Everything we build, from AI receptionists to websites, is set up and managed online.

All of the Indianapolis area, 88 cities and towns, including Fishers, Carmel, Noblesville, Greenwood, Westfield and Anderson. Because we work remotely, location within the area doesn't change what we can do.

The same as anywhere else: our prices are published and don't change by location. AI automation starts at $99 a month, a new website at $1,200 one time (or $99 a month to look after the site you have) and Google Maps and local marketing at $99 a month. Every plan is listed on our pricing page, so you know the cost before the first call.

AI automation

Indianapolis has 183 roofing contractors, 798 landscaping and tree care companies and 598 plumbing and HVAC contractors with employees (Census County Business Patterns, 2023). When a homeowner calls three companies, the first to answer usually gets the job. An AI receptionist answers every call in seconds, asks your qualifying questions and passes the lead to your team, and a missed call gets a text back within a minute.

A receptionist in Indianapolis earns a median $37,050 a year in pay alone (BLS, May 2025) and covers business hours only. An AI receptionist answers around the clock for a monthly fee, with our AI automation plans starting at $99 a month. Most clients use it alongside their team for after-hours calls, overflow and busy seasons rather than replacing anyone.

Websites

Yes. 10% of Indianapolis households get the internet only through a phone plan (Census American Community Survey), and most people searching for a local service do it on a phone. We build sites mobile-first: fast to load, with tap-to-call and a short quote form on every page. A new site is $1,200 one time on the Starter plan, or $99 a month with Site Care to look after the one you have.

Digital marketing

29% of Indianapolis homeowners moved in during 2020 or later (Census American Community Survey). New owners don't have a roofer, plumber or landscaper yet, so they search Google and ask AI assistants, then call the businesses with good reviews. A complete Google Business Profile, steady review requests and content that answers their questions are how you get found first.

Start with the fastest growing: Westfield (up 35.6%), Brownsburg (up 15.2%) and Avon (up 15.1%) from 2020 to 2024 (Census population estimates). Growing towns bring new homes and new customers who haven't picked a provider yet, so they're worth their own service-area pages, Google posts and ad targeting.

Branding

Indiana had 39,814 new business applications in 2025, 69% more than in 2019 (Census Business Formation Statistics). With that many new names, a consistent brand, the same logo, colors and voice on your trucks, website, Google profile and social media, is what makes customers remember and trust you. Our branding starts with the Essentials plan at $99 one time: a color palette, font pairing, social profile images and a one-page style sheet built from your logo.

Apps and software

A software developer in Indianapolis earns a median $106,870 a year (BLS, May 2025), and most apps need more than one person. We design and build mobile apps, web apps and SaaS products for a fixed scope. It starts with the Blueprint plan at $99 one time, a scoping call that becomes a written feature list, platform recommendation and cost range, and builds start from $1,999. For an app or site you already have, UI/UX design starts with a $99 review.

Yes, remotely. Indianapolis has 416 custom software development firms with employees (Census County Business Patterns, 2023). We work to a fixed scope rather than by the hour: our Blueprint ($99 one time) turns your idea into a written feature list, platform recommendation and cost range, and builds of mobile apps, web apps and SaaS products start from $1,999.

Nearby

Other major cities near you

Ready when you are

Pick a time that suits you. The call is free and there's no obligation.

Sources and methodology · data updated 2026-11-02
  • U.S. Census Bureau, Population Estimates Program, Vintage 2024 (CBSA and county totals)
  • U.S. Census Bureau, American Community Survey 2024 1-year estimates (tables B01003, B19013, B19001, B25077, B25003, B01002, B25001, B25024, B25035, C16001, B08301, B28002, B15003, B24080)
  • U.S. Census Bureau, County Business Patterns 2023 (establishments with paid employees)
  • U.S. Census Bureau, Nonemployer Statistics 2022
  • U.S. Census Bureau, Building Permits Survey, annual CBSA totals 2024 and 2025
  • NOAA National Centers for Environmental Information, Storm Events Database 2021–2025; NWS zone-county correlation file for zone-based events (zones covering most of their counties inside the area; mountain and high-elevation zones excluded)
  • U.S. Bureau of Labor Statistics, OEWS May 2025 metropolitan-area median annual wages
  • State law summaries. Summary only, not legal advice
  • NWS zone-county correlation file (county time zone, population-weighted)
  • FEMA National Risk Index (county), via FEMA's ArcGIS service; ratings for the area's most populous county
  • OpenFEMA Disaster Declarations Summaries v2, declarations since 2015-01-01 covering any county in the area
  • U.S. Census Bureau, Business Formation Statistics, county-level annual business applications
  • U.S. Census Bureau, Business Trends and Outlook Survey (state), share of businesses that used AI in the last two weeks (the survey now words it as 'Super Intelligence (SI), formerly AI')
  • U.S. Bureau of Labor Statistics, Quarterly Census of Employment and Wages, Q4 2025, private sector, summed over the area's counties (suppressed county figures left out)
  • U.S. Drought Monitor (NDMC, USDA, NOAA), weekly county statistics 2021–2025, the area's most populous county
  • FHFA House Price Index, all-transactions, metropolitan area (divisions where an area is split), quarterly
  • U.S. Bureau of Economic Analysis, CAINC1 personal income and CAGDP1 GDP by county (2024), summed to the area
  • U.S. Census Bureau, Business Dynamics Statistics 2023 (metropolitan area)
  • U.S. Census Bureau, Business Trends and Outlook Survey (state), latest two-week period
  • U.S. Census Bureau, Subcounty Population Estimates, Vintage 2024 (incorporated places; towns in New England)
  • NOAA NCEI U.S. Climate Normals 1991–2020, nearest first-order weather station to the principal city

Figures are for the whole area unless a county is named. Survey figures (ACS, Census business survey) are estimates. Nothing on this page is a promise of results; it describes the local market.

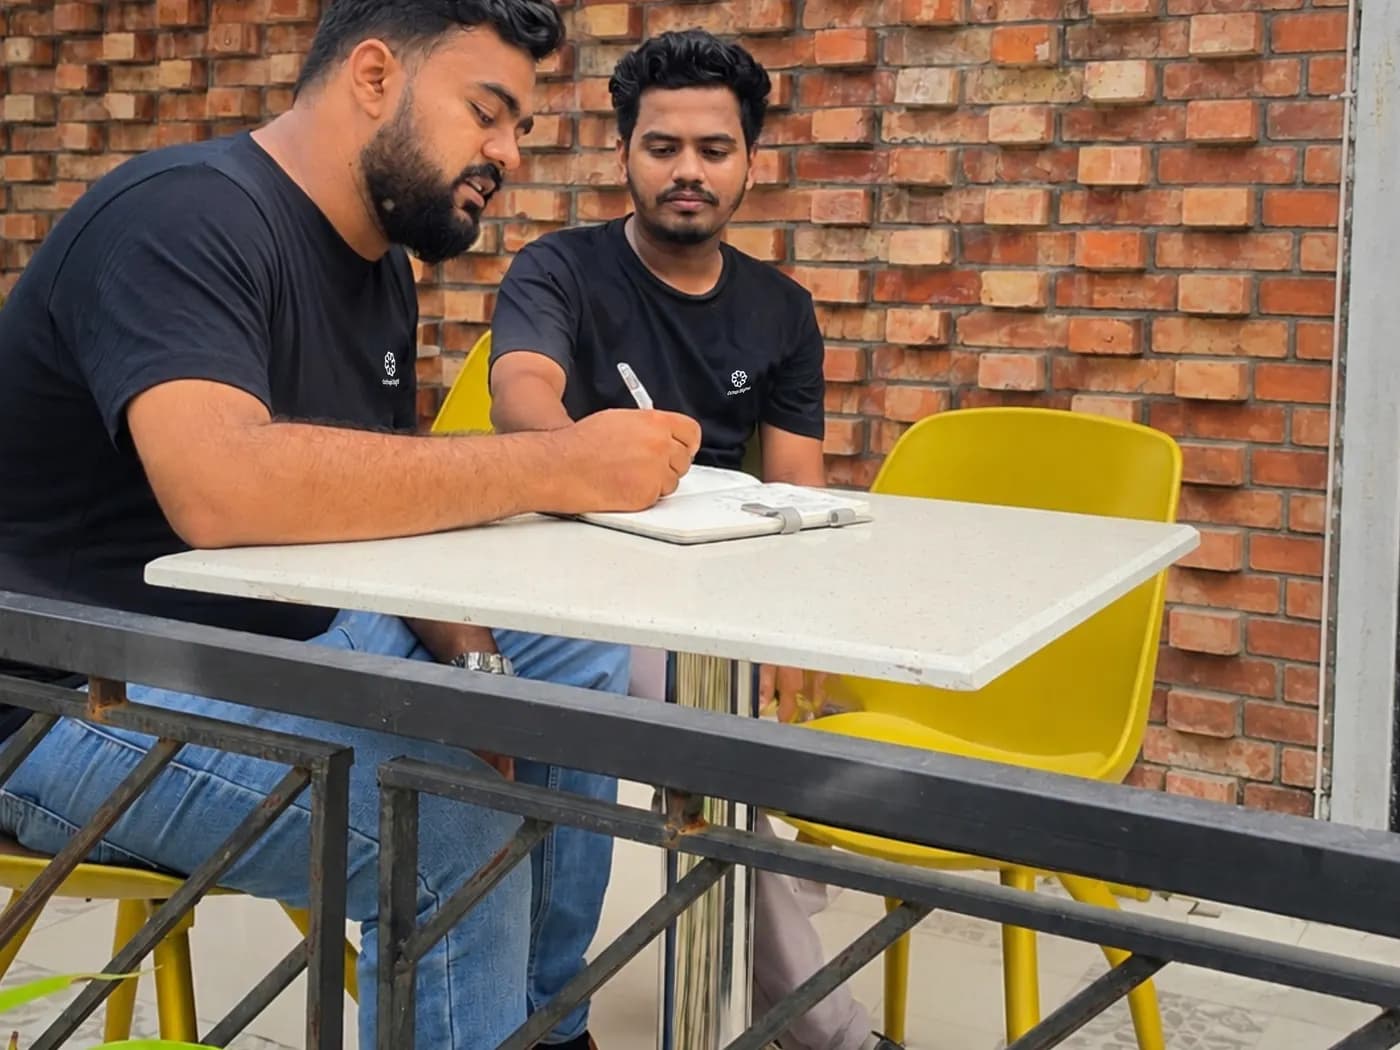
Two Octopi Digital team members planning a client project
The Octopi Digital team
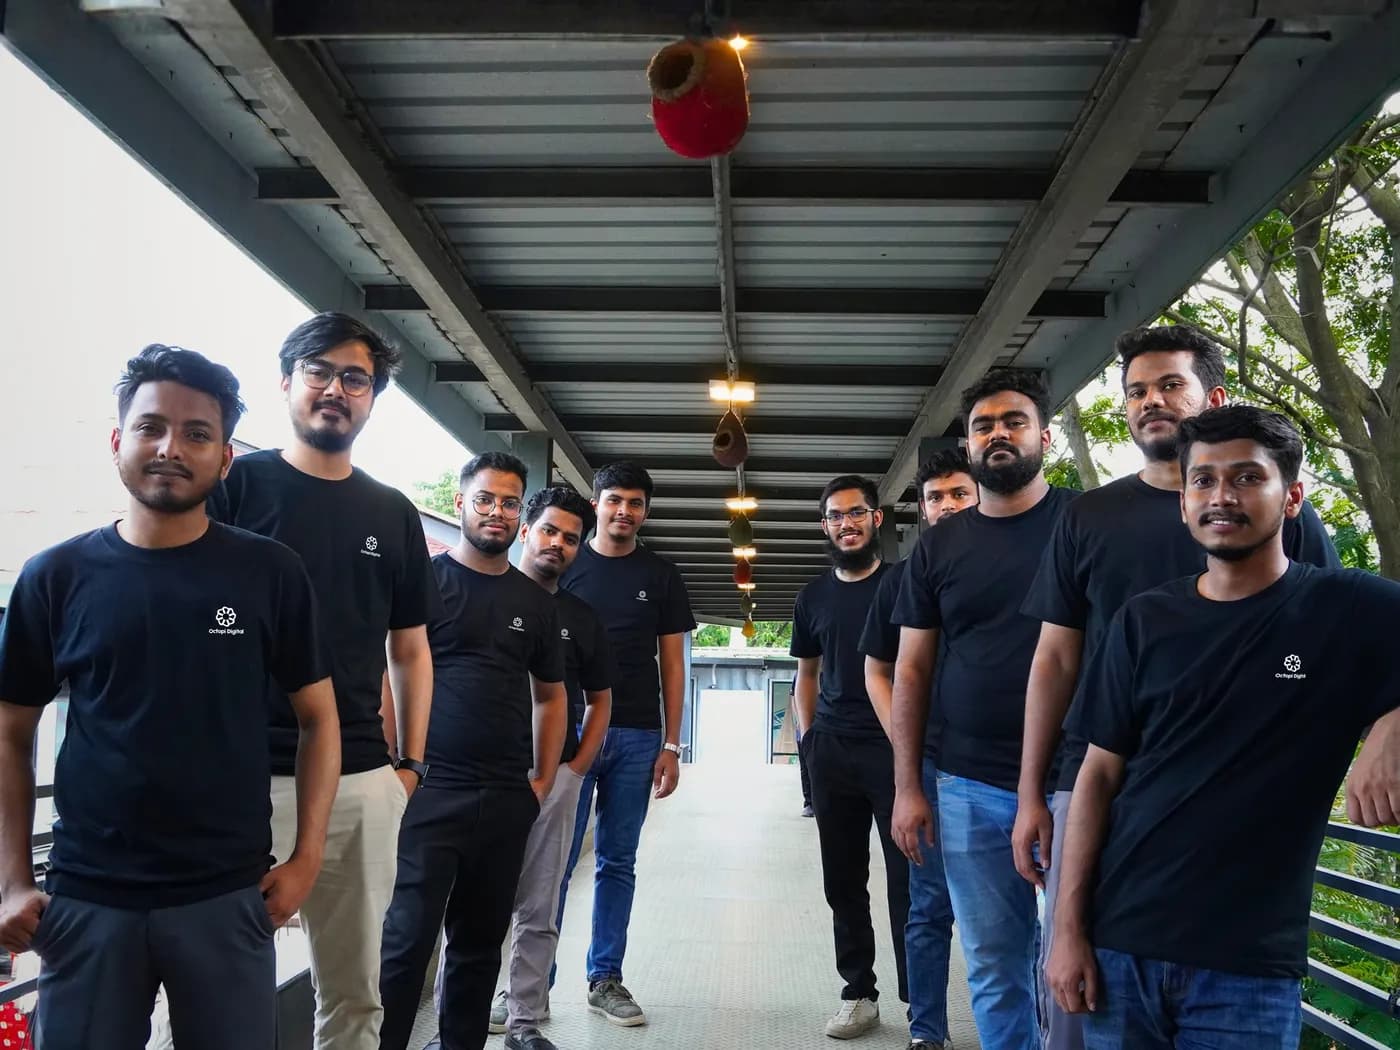
The Octopi Digital team lined up along a covered walkway

The team behind it

Real people set it up and look after it

Everything on this page is built and run by our own team of designers, developers and marketers, and you talk to the people doing the work.

people on the team
60+
of combined experience
13+ years
projects delivered
2,000+
on Google Reviews
4.9/5
Meet us on a free call

Let's grow your Indianapolis business

Book a free strategy call. We'll look at where you're losing customers today and show you what we'd build first.