Skip to content
+
+
+
+

UI/UX Design · Fresno, CA

Clear beats cleverMobile firstBuild vs. hirePhone and laptop

UI/UX Design for Fresno businesses

45% of Fresno-area residents speak a language other than English at home, and 9.5% of households have limited English. We design booking and quote screens for Fresno and Central Valley businesses that customers can understand at a glance, whatever language they think in.

Scroll
of households are smartphone-only
12.3%
of residents are 65 or older
13.7%
speak another language at home
45%
median age
34.1

Fresno-area figures from public data: Census, BLS and state sources. Sources below.

Why ui/ux design pays off in Fresno

What the Fresno numbers say

The local arguments for ui/ux design, strongest in Fresno first.

  • Clear beats clever

    45%

    speak another language at home

    45% of Fresno-area residents speak another language at home.

    Source: U.S. Census Bureau, American Community Survey 2024

  • Mobile first

    12.3%

    of households are smartphone-only

    12.3% of Fresno households go online only by phone.

    Source: U.S. Census Bureau, American Community Survey 2024

  • Build vs. hire

    $58,280

    median graphic designer pay

    Designers in Fresno earn a median $58,280 a year, web developers $77,600.

    Source: U.S. Bureau of Labor Statistics, OEWS May 2025

  • Phone and laptop

    8.4%

    of workers work from home

    8.4% of Fresno-area workers work from home.

    Source: U.S. Census Bureau, American Community Survey 2024

  • Design for every age

    13.7%

    of residents are 65 or older

    13.7% of people in the Fresno area are 65 or older.

    Source: U.S. Census Bureau, American Community Survey 2024

Want this working for your business in Fresno?

Book a free strategy call and we'll show you where to start.

Local analysis

What this means for a Fresno business

Written for Fresno-area businesses considering ui/ux design.

Updated 

Clear language is the core design job in Fresno

With 45% of residents speaking another language at home and 9.5% of households limited in English, a form full of trade terms or long instructions loses close to half the audience before the first field. We write screens around one question each, use words a customer would say out loud, pair icons with labels, and show examples beside inputs. Where a business serves many customers who prefer another language, we design layouts with space for a second-language version from the start, rather than squeezing translations in later.

The phone is the main screen for much of the Valley

12.3% of Fresno households go online only by phone, and just 8.4% of workers work from home, so most customers look you up on a phone between jobs, at lunch or after a shift. We design every flow at phone width first, keep forms short enough to finish in one sitting, use tap-to-call and text confirmation, and make sure pages load fast on mobile data. A desktop layout follows, but it isn't where most decisions happen here.

Pest control stands out among local trades

Pest control companies are 1.55 times as common in the Fresno area as nationally, 90 of them. Their customers usually sign up for recurring service, so the design has to make the first booking simple and later changes painless: adding a treatment, moving a visit, paying online. Dental and physician offices, 473 and 710 respectively, need the same thinking for patient intake. With a median age of 34.1 and 13.7% of residents 65 or older, we test with both younger and older users.

How we'd approach a Fresno project

Clovis grew 6.5% since 2020, Madera 4.2% and Reedley 3.6%, against 2.1% for the metro, so a contractor covering those towns should confirm service area early. We'd review your most important flow, wireframe a plainer version, test it with a handful of your actual customers, including those who prefer another language, and hand over final screens. A designer in Fresno earns a median $58,280 a year and a web developer $77,600. Our Essentials plan is $99 one time; Starter is $1,500 and Growth $2,500.

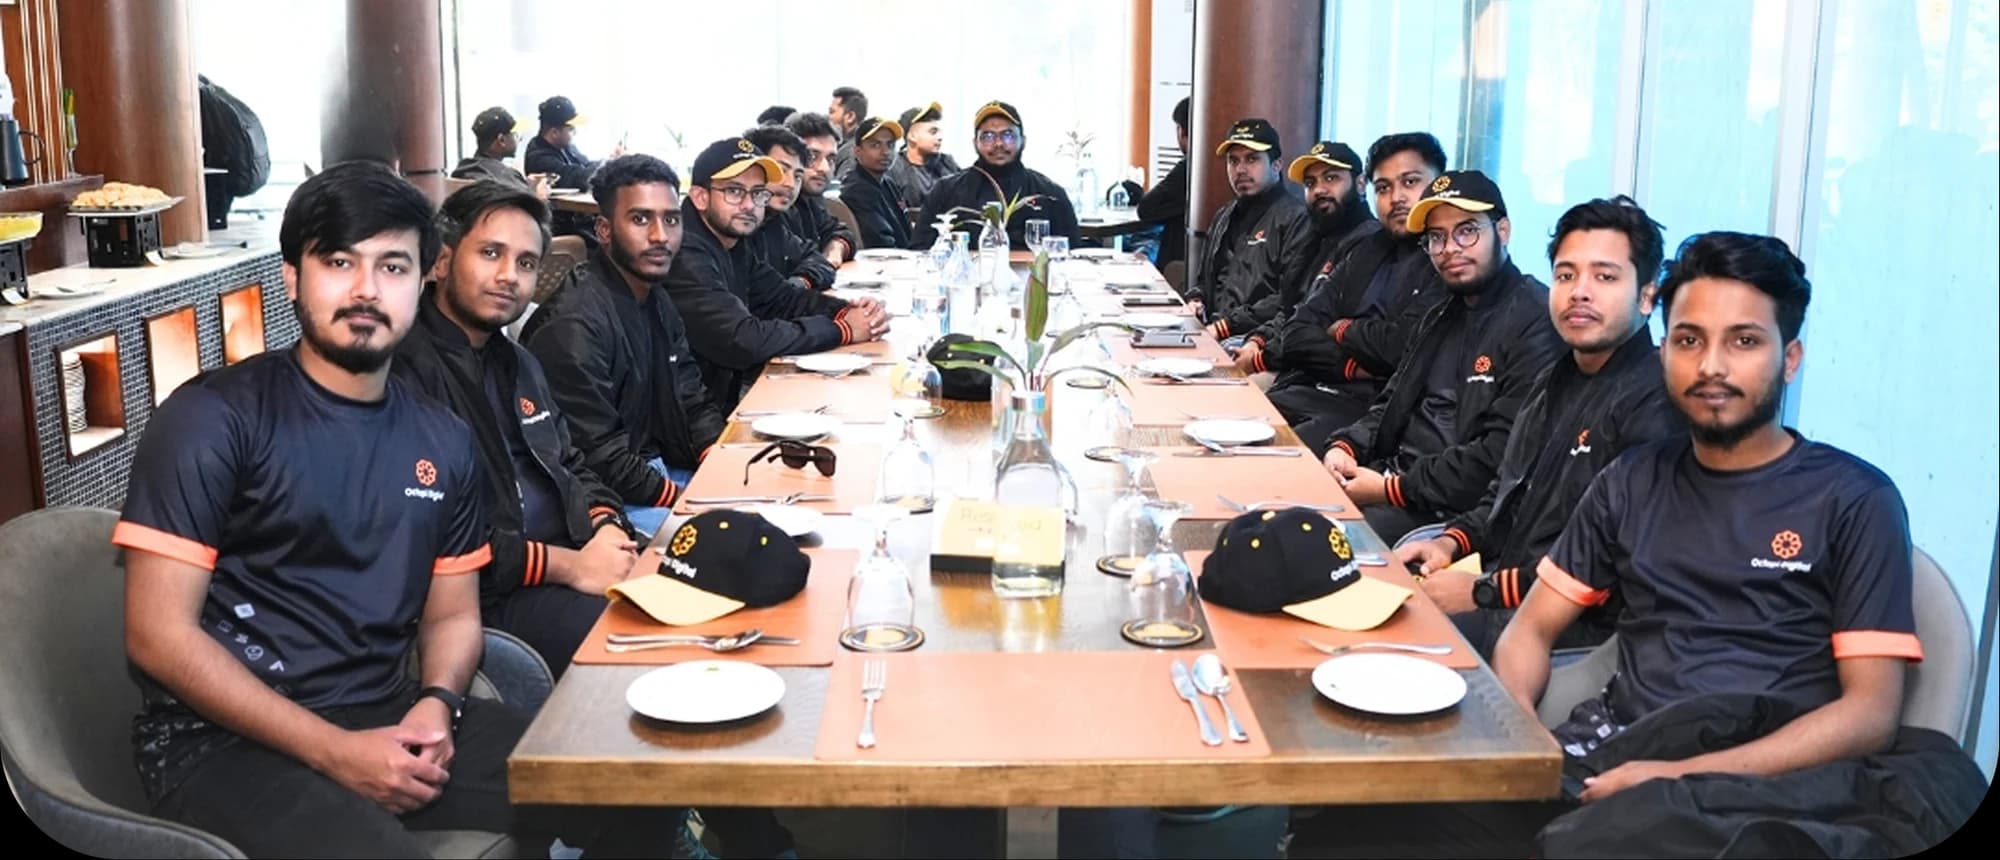
The Octopi Digital team at a long table during a team lunch

The team behind it

The people who set up ui/ux design for Fresno-area businesses, and look after it once it's live.

Every missed call is a job for someone else

See how an AI front office would handle calls for your business in Fresno, on a free call.

Build vs. hire

Hiring in Fresno vs. working with us

Hire in Fresno

A graphic designer

$58,280

median pay a year

One designer, before research, testing or development.

Source: U.S. Bureau of Labor Statistics, OEWS May 2025

Work with us

Octopi Digital UI/UX Design

$99 one time

published price

  • The same published prices in every city.
  • No long contracts to get started.
See all plans

Local data

Fresno at a glance, for ui/ux design

of households are smartphone-only
12.3%
U.S. Census Bureau, American Community Survey 2024
of residents are 65 or older
13.7%
U.S. Census Bureau, American Community Survey 2024
speak another language at home
45%
U.S. Census Bureau, American Community Survey 2024
median age
34.1
U.S. Census Bureau, American Community Survey 2024
of workers work from home
8.4%
U.S. Census Bureau, American Community Survey 2024
median graphic designer pay
$58,280
U.S. Bureau of Labor Statistics, OEWS May 2025

Fresno's industries

UI/UX Design for the trades and practices most common in Fresno

Counted by the Census Bureau. The ones with more businesses per person than the U.S. average come first.

  • Pest control

    90 pest control companies

    1.55×vs U.S.

    55% more per person than the U.S. average.

  • Dental

    473 dental offices

    0.99×vs U.S.

    1% fewer per person than the U.S. average.

  • Medical practices and primary care

    710 physician offices

    0.99×vs U.S.

    1% fewer per person than the U.S. average.

  • Roofing

    84 roofing contractors

    0.94×vs U.S.

    6% fewer per person than the U.S. average.

  • Electrical

    249 electrical contractors

    0.85×vs U.S.

    15% fewer per person than the U.S. average.

  • Painting

    113 painting contractors

    0.84×vs U.S.

    16% fewer per person than the U.S. average.

  • HVAC

    279 plumbing and hvac contractors

    0.71×vs U.S.

    29% fewer per person than the U.S. average.

  • Plumbing

    279 plumbing and hvac contractors

    0.71×vs U.S.

    29% fewer per person than the U.S. average.

Not sure where to start?

A short call with our team, and you leave with a plan and a price.

Where to start

Your first steps in Fresno

  1. Design the phone screens first: 12.3% of Fresno households are smartphone-only.

  2. Use larger text and strong contrast: 13.7% of people here are 65 or older.

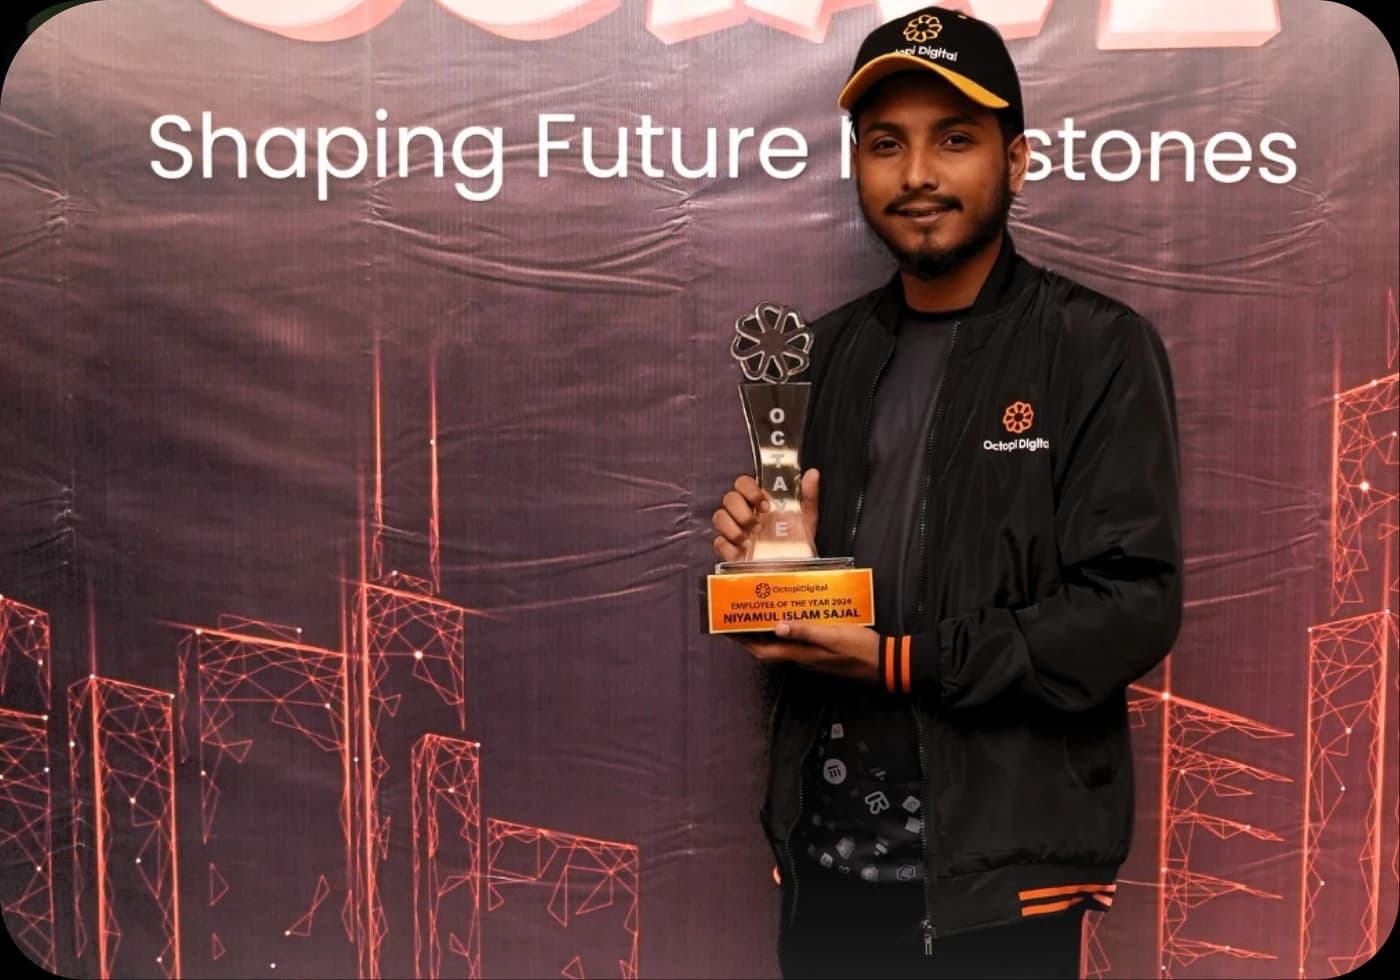
An Octopi Digital team member holding an award

Who you'll work with

The same team that prices your UI/UX design builds it and looks after it.

Not sure which plan fits?

Get a clear UI/UX design quote on a free call

  • A 30-minute call about your business
  • The right plan, or a custom scope
  • A fixed price before any work starts

FAQ

UI/UX Design in Fresno: questions

Answers built from Fresno-area data and our published prices.

6 questions answered

Octopi Digital founder

Still have a question?

Talk it through with our team on a free strategy call.

Book a Free Call

Our prices are published and the same in every city (Essentials is $99 one time, Starter $1,500 one time, Growth $2,500 one time and Custom priced on a call), compared with a median $58,280 a year in pay alone for one graphic designer in the Fresno area (BLS, May 2025).

13.7% of people in the Fresno area are 65 or older (Census ACS 2024), so we use larger text, strong contrast, big buttons and fewer steps, which helps them most and makes the design easier for everyone.

Yes: 12.3% of Fresno-area households go online only through a phone, so we design and test the phone screens first, then the desktop version.

The largest groups of local businesses in the Fresno area are 1,772 restaurants, 710 physician offices and 560 auto repair shops (Census County Business Patterns 2023), and each of them books, quotes or takes intake online in ways that can be made shorter and clearer.

8.4% of Fresno-area workers work from home and 91.7% of households have broadband (Census ACS 2024), so desktop sessions matter as much as phone ones and we test every flow on both.

45% of Fresno-area residents speak another language at home and 9.5% of households have limited English (Census ACS 2024), so plain labels and one question per screen decide whether those bookings get finished.

More for Fresno businesses

Other services in Fresno

  • Fresno receptionists earn a median $39,520 a year. Calls don't stop at 5 p.m.

  • 12,238 new businesses applied to open in the Fresno area in 2025.

  • 12,238 new businesses applied to open in the Fresno area in 2025.

  • 45% of Fresno-area residents speak a language other than English at home.

  • 12.3% of Fresno households get online only through a phone.

  • 72,822 one-person businesses are registered around Fresno.

  • 36% of people in the Fresno area speak Spanish at home.

Other cities

UI/UX Design in other major U.S. cities

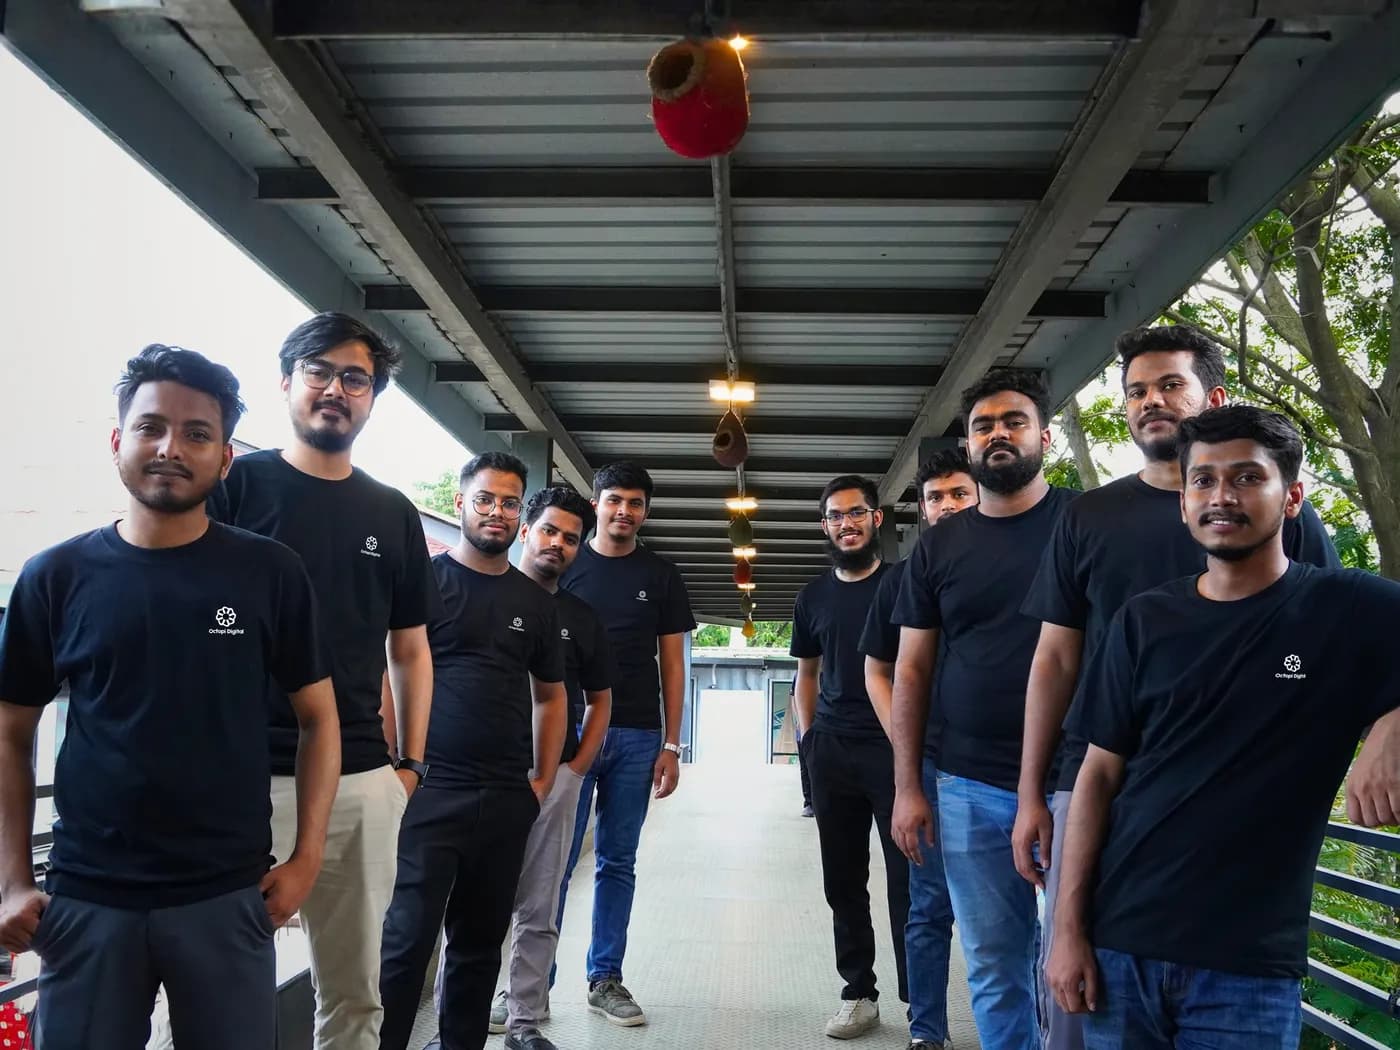
The Octopi Digital team lined up along a covered walkway
The Octopi Digital team
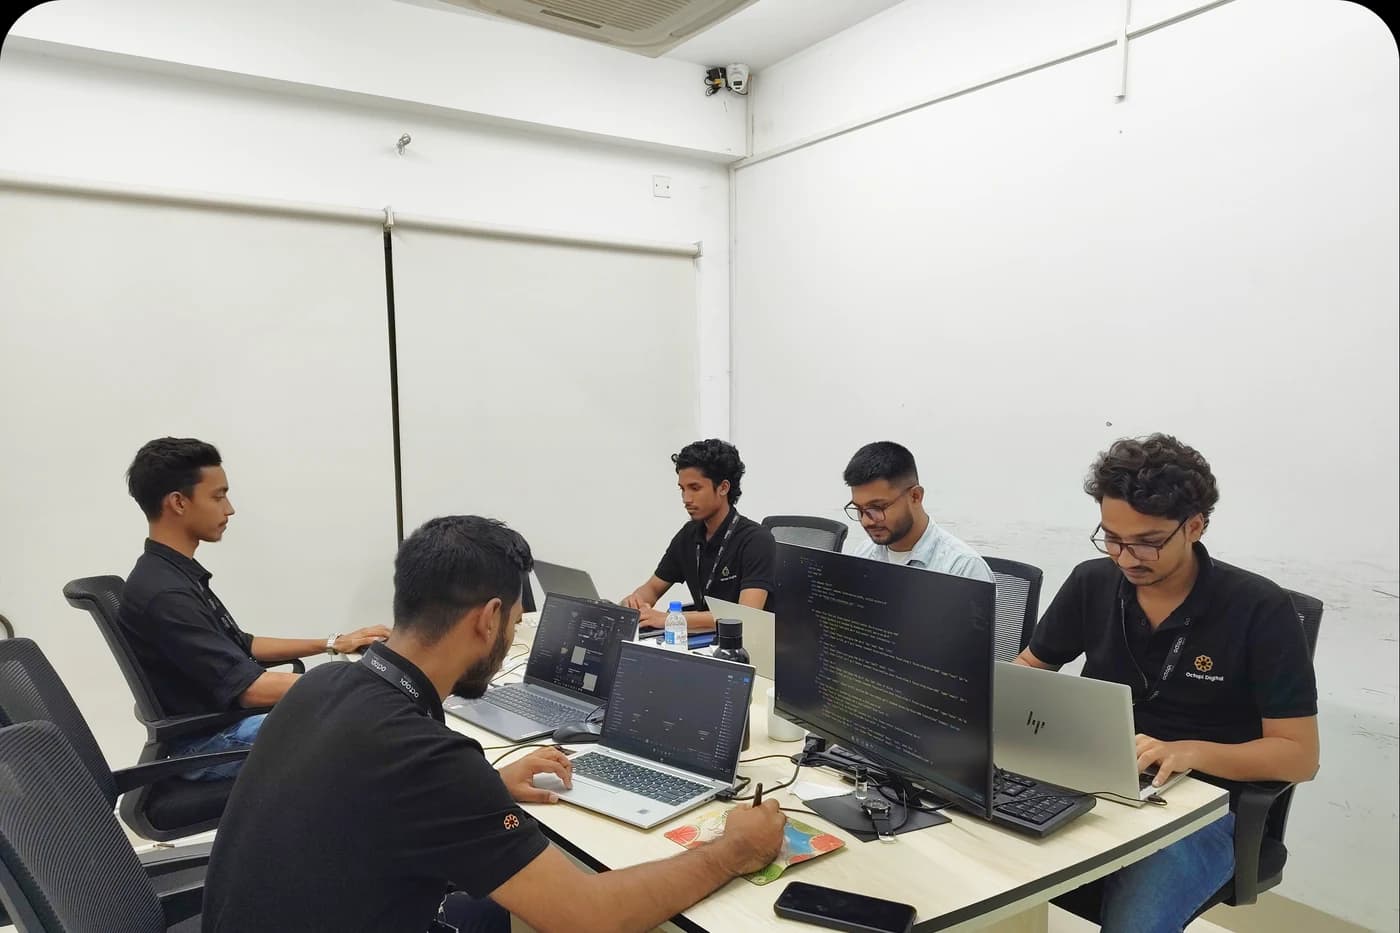
Octopi Digital team members working in the office

The team behind it

Real people set it up and look after it

Everything on this page is built and run by our own team of designers, developers and marketers, and you talk to the people doing the work.

people on the team
60+
of combined experience
13+ years
projects delivered
2,000+
on Google Reviews
4.9/5
Meet us on a free call
Sources and methodology · data updated 2026-11-02
  • U.S. Census Bureau, Population Estimates Program, Vintage 2024 (CBSA and county totals)
  • U.S. Census Bureau, American Community Survey 2024 1-year estimates (tables B01003, B19013, B19001, B25077, B25003, B01002, B25001, B25024, B25035, C16001, B08301, B28002, B15003, B24080)
  • U.S. Census Bureau, County Business Patterns 2023 (establishments with paid employees)
  • U.S. Census Bureau, Nonemployer Statistics 2022
  • U.S. Census Bureau, Building Permits Survey, annual CBSA totals 2024 and 2025
  • NOAA National Centers for Environmental Information, Storm Events Database 2021–2025; NWS zone-county correlation file for zone-based events (zones covering most of their counties inside the area; mountain and high-elevation zones excluded)
  • U.S. Bureau of Labor Statistics, OEWS May 2025 metropolitan-area median annual wages
  • State law summaries. Summary only, not legal advice
  • NWS zone-county correlation file (county time zone, population-weighted)
  • FEMA National Risk Index (county), via FEMA's ArcGIS service; ratings for the area's most populous county
  • OpenFEMA Disaster Declarations Summaries v2, declarations since 2015-01-01 covering any county in the area
  • U.S. Census Bureau, Business Formation Statistics, county-level annual business applications
  • U.S. Census Bureau, Business Trends and Outlook Survey (state), share of businesses that used AI in the last two weeks (the survey now words it as 'Super Intelligence (SI), formerly AI')
  • U.S. Bureau of Labor Statistics, Quarterly Census of Employment and Wages, Q4 2025, private sector, summed over the area's counties (suppressed county figures left out)
  • U.S. Drought Monitor (NDMC, USDA, NOAA), weekly county statistics 2021–2025, the area's most populous county
  • FHFA House Price Index, all-transactions, metropolitan area (divisions where an area is split), quarterly
  • U.S. Bureau of Economic Analysis, CAINC1 personal income and CAGDP1 GDP by county (2024), summed to the area
  • U.S. Census Bureau, Business Dynamics Statistics 2023 (metropolitan area)
  • U.S. Census Bureau, Business Trends and Outlook Survey (state), latest two-week period
  • U.S. Census Bureau, Subcounty Population Estimates, Vintage 2024 (incorporated places; towns in New England)
  • NOAA NCEI U.S. Climate Normals 1991–2020, nearest first-order weather station to the principal city

Figures are for the whole area unless a county is named. Survey figures (ACS, Census business survey) are estimates. Nothing on this page is a promise of results; it describes the local market.

Ready to talk about ui/ux design for your Fresno business?

Book a free strategy call. We'll look at where you are today and show you what we'd do first.